
Non classé
Navigating the Energy Demands of AI: How Data Center Growth Is Transforming Utility Planning and Power Infrastructure

Published
1 an agoon
By
Powering data centers is a challenge for utilities.
Data centers are highly valued by utilities because they consume large amounts of electricity with consistent, predictable demand patterns that remain steady throughout both the day and the year.
The explosive growth in power demand, driven largely by Artificial Intelligence (AI) and cloud computing, has overwhelmed the traditional electrical grid planning and construction timelines.
Introduction
New hyperscale data centers often require 100 MW to 500 MW of power, which is the demand of a small to medium-sized city. Utilities are happy to accept new business, but the problem is that data center developers want this power now and utilities are not prepared to respond so quickly. Expanding transmission and substation capacity through utilities can take 5 to 10 years due to lengthy processes for planning, permitting, environmental reviews, and construction. Data center developers, especially those focused on the AI race, prioritize “time to power” above almost all else. Delays mean lost competitive advantage and revenue. Developers are willing to pay a premium for faster power access and have taken some new and unique approaches for powering data centers.
The need for gigawatts of power on tight deadlines has forced data center developers to become major energy developers. They are doing this in three main ways:
Funding Renewables via PPAs: Hyperscalers like Amazon, Microsoft, and Google are the world’s largest corporate buyers of clean energy. Their long-term Power Purchase Agreements (PPAs) provide the financial certainty needed for developers to build hundreds of new utility-scale wind and solar farms.
On-Site, Grid-Independent Power: To bypass multi-year grid connection queues, developers are building their own on-site power. They have purchased natural gas turbines, fuel cells, and co-located them next to renewable power, independently of the local utility.
Direct Connections to Power Plants: Data center campuses are now being planned and built adjacent to existing power plants. There are several major data center developers like Microsoft, Google, Meta, and Amazon web services that have signed PPA’s for existing nuclear power, like the Microsoft deal for a 20-year PPA to enable the restart of the shuttered Three Mile Island reactor in Pennsylvania. There is interest and research into PPA’s for new SMR, advanced, and full-scale nuclear power
Example of the new paradigm
The massive xAI “Colossus” data center project in Memphis, Tennessee, showcases a new paradigm for building AI infrastructure at incredible speed. To rapidly meet the massive power demands of the Colossus data center, xAI used portable or mobile natural gas-powered turbines which are typically used for disaster recovery or fast, temporary power generation. This resulted in legal challenges from environmental groups regarding air quality permits and were eventually removed.
Initial reports mentioned around 18-20 turbines, but later aerial images suggested as many as 35 turbines were installed and operating, with a combined capacity estimated at over 70 MW, though the total demand for Phase I was 150 MW. The TVA (Tennessee Valley Authority) Board of Directors officially approved the plan to supply a total of 150 MW of power to the xAI facility in November 2024.
The connection to the full 150 MW load required the construction of a new electric substation near the data center, which was paid for by xAI. By May 2025, the massive Colossus supercomputer facility was connected to the new substation, providing it with 150 MW of power from the MLGW/TVA grid.
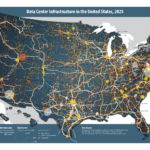
The map shows where new data centers are being built.
Data Centers planned in the US
While many data center plans are secrets, current expansion announcements focus on regions like:
Northern Virginia (Ashburn/Loudoun & Prince William Counties): The largest existing and planned capacity globally.
Phoenix, Arizona (Maricopa County): A major emerging market with high growth projected.
Dallas-Fort Worth (DFW), Texas: Significant planned growth.
Atlanta, Georgia (I-85 Corridor): High percentage growth projected, with major new investments.
Salt Lake City, Utah: A fast-growing secondary market.
Impact on utilities and power costs.
There is fierce competition to build and power data centers unlike anything we have seen in the utility industry before, but there is also significant new power growth due to the growing power demands for electric powered transportation (mostly electric passenger cars) and to a lesser extent the electrification of HVAC and industrial electrification. The increased demand for power requires new utility investment in transmission, substations, and distribution.
The generation side is split between vertically integrated regulated utilities and Independent Power Producers (IPPs). Independent Power Producers (IPPs) have generally dominated the buildout of new capacity (especially renewables and battery storage), particularly in deregulated markets, because they can respond to market price signals and secure private long-term contracts (PPAs) faster than utilities navigating regulatory approval cycles.
Utilities remain the primary developers in the regulated markets and are also heavily investing in transmission and distribution infrastructure across all markets to physically connect the new generation built by both themselves and IPPs.
With data centers buying and building power there is a supply and demand issue that is driving up the cost of power. A small utility or municipal power company without generation buys power from IPP’s or other utilities suppliers and is competing with the data centers.
Utilities see data centers as great customers. They buy lots of power with steady daily and seasonal loads. They match up well to base load generators like nuclear or coal power and do not require oversized transformers or wires like a large level 3 EV charging facility would need. Of course, data center developers are concerned about power costs and new data centers have many ways they can be better customers and get better power rates from utilities. About 40% of the data center power goes to HVAC. There are ways of using thermal batteries to shift the HVAC load away from costly peak power hours typically 5-9pm There is a trend for data centers to transition to large grid scale batteries that are replacing the traditional UPS batteries. Such batteries can provide useful grid services to utilities as well as provide backup power to the data center. A town or utility that adds data centers to their grid will gain revenue for power sold. More revenue helps to cover the large overhead costs that utilities have for wires, poles, truck, staff, and buildings. This can reduce the overall cost of power in such towns or utility service areas
The Leading AI Model Developers
1. OpenAI (in partnership with Microsoft). Flagship Products: The GPT series ChatGPT Microsoft is their primary investor and exclusive cloud partner, integrating OpenAI’s models deeply into their own products like the Azure cloud platform and Microsoft Copilot.
2. Google (specifically Google DeepMind) Flagship Product: The Gemini family of models (including Gemini Pro, Ultra, and future versions).
3. Meta (formerly Facebook). Flagship Product: The Llama series of models (e.g., Llama 3).
4. Anthropic Flagship Product: The Claude family of models (e.g., Claude 3, Claude 3.5 Sonnet). They are a major competitor to both OpenAI and Google and are heavily backed by Amazon and Google.
5. xAI Flagship Product: Grok. Founded by Elon Musk, xAI aims to create an AI to “understand the true nature of the universe.”
6. DeepSeek AI. Flagship Product: The DeepSeek model family (e.g., DeepSeek-V2). They are a leading Chinese AI research lab that has released a series of extremely powerful open-source models that are highly regarded, particularly for their exceptional coding and mathematical reasoning capabilities.
Is there an investment bubble like the dot com bubble?
The short answer yes, the massive overspending by companies like Meta will shift from being first at all costs to a more rational return on investment criterion. However, the race is not stopping, and it is unlikely to see the AI race coming to a halt. Current spending projections are:
2025: ~$400 Billion The spending in 2025 is dominated by the massive capital investment in building the physical infrastructure for AI. Data center construction and the procurement of tens of billions of dollars’ worth of NVIDIA GPUs and other AI accelerators represent the largest share of this cost.
2026: ~$550 Billion The rapid year-over-year growth is driven by the ongoing AI arms race. As new, more powerful AI models are released, the demand for even larger data centers and next-generation GPUs continues to accelerate. Spending on the electrical infrastructure to power these facilities becomes a major and growing line item.
2030: Over $1.5 Trillion The leap to a multi-trillion-dollar run rate by 2030 is based on the widespread enterprise adoption of AI. By this time, spending will shift from being concentrated among a few hyperscaler’s to being broadly distributed as thousands of companies build their own smaller AI systems and pay for massive amounts of AI-powered cloud services.
Electric Power: This is the fastest-growing operational cost. Powering the millions of GPUs in these data centers is projected to become a multi-hundred-billion-dollar annual expense by the end of the decade, making energy the primary long-term bottleneck for AI growth.
The race to develop the best AI applications that will provide your news, your library, your entertainment, your education, and maybe even your companionship. The AI investment race is showing early signs of potential market saturation and risk, but it is unlikely to subside completely due to fundamental differences from the dot-com bubble. Instead, most analysts predict a shift toward consolidation, disciplined spending, and a focus on profitability. The shake out could result in a small group of winners emerging, but the money for better AI models and new applications will keep flowing. This “AI Oligopoly” may be the current hyperscalers: Microsoft/OpenAI, Google, Amazon (with Anthropic), and Meta. The prize is not primarily scientific or industrial AI. It is about owning influence: I.e. the source of truth, knowledge, advertising, guiding your purchases, owning your news, owning your screen time, being your trusted teacher, partner, and friend. Having the best AI frontier model and model user interfaces is the key to success.
Factor
AI Investment Race
Outlook
Pace of Investment
Driven by an “AI arms race” where companies fear losing more than they fear overspending. This urgency is causing massive, debt-fueled spending on chips and data centers.
Likely to Slow/Correct. Infrastructure spending cannot increase indefinitely. Goldman Sachs and others predict an “inevitable slowdown” in data center construction, which will impact chip and power suppliers.
Productivity Gap
A significant gap exists between the trillions being invested in AI infrastructure and the proven, monetized revenue from AI applications.
Consolidation is Coming. Many smaller, unprofitable AI application startups are likely to fail or be acquired, similar to the dot-com era, as capital becomes more disciplined.
Technological Potential
The underlying technology (AGI/generative AI) is widely seen as genuinely transformational (a technological revolution).
Unlikely to Subside. The technology will not fail; the business models and valuations built upon it are the primary risk. Investment will pivot from “build it all now” to “build what is profitable.”
Conclusion and Outlook
The unprecedented demand in the US for lightning-fast power connections by developers of data centers is not matching traditional ways utilities provide power to new customers. As a result, there are a range of new and creative ways to provide that power. Developers are building their own power generation and microgrids. Data centers are becoming power companies themselves. They are building large BESS battery systems that not only provide for UPS power backup but provide grid services to utilities. Utilities and data center developers are collaborating on building new power generation, new or upgraded substations, and the power lines to meet the power and reliability requirements of data centers.
Data centers are a prized customer for utilities, they consume lots of steady power around the clock and throughout the seasons and they often have far more flexibility to provide ancillary services to the utility than typical residential, commercial or industrial customers. While they are schedule driven, they are less sensitive to the price of power in the short term as the AI race has focused on securing power faster than competitors to get the best AI models sooner and lock in a customer base with superior AI applications.
Hyperscalers have created shorter term PPAs for fossil power and long term PPA’s for massive quantities of renewable power and have memorandums of understanding for future nuclear power that may come from new SMR and advanced reactors. While data center loads match up well to base load generation like nuclear or coal, they are often powered by intermittent generation like solar and wind with battery storage.
Data center developers seek out locations that can provide power quickly, have the water and land resources needed and where local zoning and community are favorable. They are also building where it will be easy to expand in the future.
EV batteries are trending to charge at faster rates. Large high voltage DC EV charging stations can require massive power to charge dozens of cars simultaneously and utilities need a strong grid to service this growing load. Most EV charging occurs at home and distribution utilities are adapting to new loads with more powerful transformers and related low and medium voltage distribution infrastructure. New loads for HVAC and industrial electrification are steadily increasing over the next decade and beyond.
AI developers need more than just electric power to win the AI race. They need to train on accurate but diverse curated data. This includes selecting the most appropriate model architecture and employing techniques like Active Learning (to find the most useful data to train on) and Data Distillation (to reduce the size of the dataset without losing quality). They start with peta-bytes of data from public, private, and internally generated sources. This massive raw data pool is labeled, filtered, cleaned, and tokenized (broken down into the pieces the model understands). This step dramatically reduces the final size of the data AI uses for training. Data centers also need secure, reliable, and fast data connectivity.
The US is behind in securing new power. China already has a grid that is larger than the US and European grids combined and while NVIDIA GPU chips are restricted, China is in a far better position to provide power to AI Data centers compared to the US. The table below shows estimated grid power additions to 2030, and China is outpacing the US in every power sector.
Grid Energy
Global Additions in 2024 (GW)
US Additions 2025 to 2030
i.e., five years (GW)
China Additions 2025 to 2030
i.e., five years (GW)
Global Additions 2025 to 2030
i.e., five years (GW)
Solar
452
220 to 270
1,200 to 1,500
3000 to 4000
Wind
113
60 to 75
400 to 500
600 to 700
Coal
44.1
-50 to -70
120 to 180
160 to 240
Gas and Oil
25.5
25 to 35 GW
70 to 100
190 to 260
Hydro
24.6
2 to 4
60 to 80
125 to 175
Nuclear
6.8
~2 GW (uprating only)
30 to 40
50 to 70
Biofuel
4.6
1 to 2
8 to 10
30 to 40
Geothermal
0.4
2 to 3
2 to 3
10 to 15
Recent US policies are discouraging solar, wind, and battery storage, which is slowing the deployment of the cheapest, cleanest, and fastest deploying sources of new power. US policy is supporting more gas and nuclear power, but new gas power plants have supply chain constraints like gas turbines, so these power sources are not matching the demands of data center developers. This constrained power supply threatens to inflate electricity prices for consumers and businesses and risks leaving the nation unable to cleanly and affordably meet the surging power demands of data centers and broader electrification.
The post Navigating the Energy Demands of AI: How Data Center Growth Is Transforming Utility Planning and Power Infrastructure appeared first on Logistics Viewpoints.
You may like
Non classé
Can Real-Time Voice Translation Improve Warehouse Productivity and Employee Engagement?
Published
19 heures agoon
14 octobre 2026By
Labor shortages remain one of the most persistent challenges facing warehouse operators. Yet an often-overlooked issue sits beneath the labor discussion: communication. Modern distribution centers frequently employ associates who speak a variety of languages. While workforce diversity is a strength, language barriers can create delays, safety risks, training challenges, and unnecessary dependence on a small number of bilingual employees.
This challenge is becoming increasingly relevant across North America. Distribution centers routinely employ associates representing multiple linguistic backgrounds. As labor shortages persist, operators are focusing less on hiring workers who speak a common language and more on ensuring communication systems can accommodate workforce diversity. Technology that bridges language gaps can therefore expand the labor pool while improving workforce effectiveness.
Historically, many operations have relied on supervisors or bilingual associates to bridge communication gaps. The problem is that those employees are frequently pulled away from their primary responsibilities to interpret instructions, explain process changes, or translate safety information. In a high-velocity warehouse environment, those interruptions create hidden productivity losses.
Recent advances in real-time voice translation technology are changing this dynamic. Solutions such as Relay’s TeamTranslate allow workers to communicate in their preferred language while messages are translated and delivered to others in near real time.
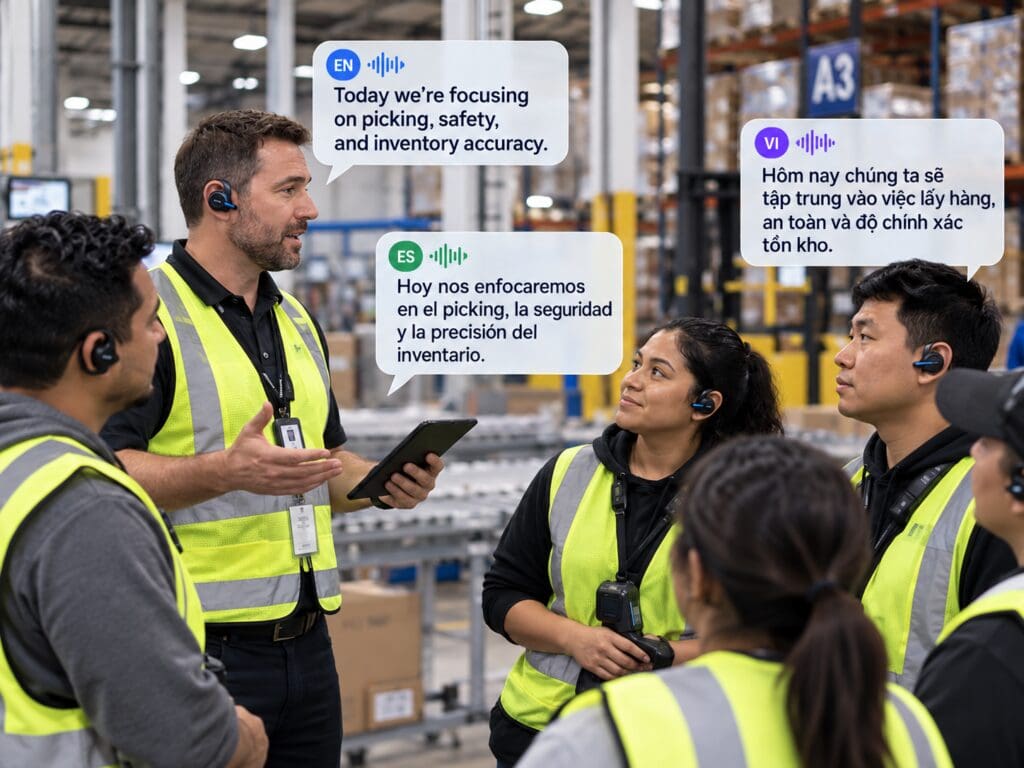
Consider a common warehouse scenario. A distribution center employs workers who primarily speak English, Spanish, and Vietnamese. During a shift startup meeting, supervisors must communicate labor priorities, inventory issues, quality concerns, and safety reminders. Without automated translation tools, information often flows through a bilingual intermediary. Even when translation is accurate, the process consumes time and introduces opportunities for misunderstanding.
With real-time translation, every worker can hear instructions in a familiar language. Communication becomes direct rather than dependent on an interpreter. Managers spend less time repeating instructions, and bilingual associates remain focused on their assigned tasks instead of serving as unofficial translators.
Relay highlights examples from warehouse operations where managers reported stronger understanding between English- and Spanish-speaking associates after implementing translation capabilities. Improved understanding contributed to better alignment and higher production levels.
The ROI opportunity can be meaningful. Consider a 200-person distribution center operating two shifts. If five supervisors each spend fifteen minutes per day locating a bilingual employee to translate instructions, answer questions, or communicate process changes, the facility loses more than 625 supervisory hours annually. At a fully burdened labor cost of $40 per hour, that represents approximately $25,000 in indirect labor costs before accounting for throughput improvements, reduced errors, and fewer delays.
The impact extends beyond productivity. Safety is another significant consideration. Warehouses depend on clear communication for forklift traffic management, hazardous material handling, evacuation procedures, and incident reporting. When critical messages are misunderstood because of language barriers, the consequences can be serious.
Training and onboarding may benefit as well. New employees often face a steep learning curve. Translation-enabled communication allows new hires to learn in their preferred language, potentially reducing training time while increasing confidence.
An emerging category of frontline communication technology is focused on solving these challenges. Vendors such as Relay, Zebra Workforce Connect, Microsoft Teams Walkie Talkie, Theatro, Honeywell Voice, and WorkJam are expanding communication capabilities for deskless workers. Historically, many solutions focused on push-to-talk communication or task management. AI-powered language translation introduces a new capability by directly addressing communication friction between workers.
Perhaps the most interesting impact is cultural rather than operational. Many warehouses consist of diverse teams that work side by side every day but communicate primarily within their own language groups. Technology that allows people to communicate naturally can help create a more inclusive workplace. Employees become more comfortable asking questions, sharing ideas, and participating in team discussions.
This matters because engagement and retention are increasingly strategic priorities. Employees who feel heard and understood are more likely to contribute, collaborate, and remain with an organization.
Takeaway and Market Outlook
For years, warehouse automation investments have focused primarily on moving products more efficiently. Robots, ASRS systems, autonomous mobile robots, and warehouse software have targeted improvements in material flow. Yet communication remains one of the least automated processes within many facilities.
Real-time voice translation represents an interesting shift because it focuses on people rather than equipment. By reducing dependence on bilingual intermediaries, organizations can improve productivity, accelerate onboarding, strengthen safety compliance, and create a more inclusive work environment.
Looking ahead, AI-enabled communication tools are likely to become increasingly common across warehouse and manufacturing environments. Facilities have spent decades optimizing the movement of inventory. The next frontier may be optimizing the flow of information between workers. If technologies such as real-time voice translation continue to demonstrate measurable workforce and operational benefits, they could become a standard component of the digital warehouse technology stack.
The post Can Real-Time Voice Translation Improve Warehouse Productivity and Employee Engagement? appeared first on Logistics Viewpoints.
Non classé
Blue Yonder Is Redesigning Supply Chain Software Around Decisions, Not Screens
Published
19 heures agoon
14 octobre 2026By
Blue Yonder is rethinking how users interact with supply chain applications as artificial intelligence takes on a larger role in planning and execution.
During a recent analyst briefing, Blue Yonder Chief Design Officer Nunzio Esposito outlined the company’s effort to move away from traditional application navigation and toward a more decision-centric model. The company is bringing together AI agents, recommendations, workflows, mobile capabilities, and collaboration tools through what it calls Blue Yonder Orchestrator.
The objective is to reduce the amount of manual navigation and repetitive interaction required from users. Instead of moving through multiple screens to find information and determine what requires attention, Blue Yonder wants its applications to surface the relevant information, recommendations, and decisions more directly.
The broader idea is that users should spend less time operating the mechanics of enterprise software and more time making higher-value decisions.
From Navigation to Orchestration
At the center of the strategy is Blue Yonder Orchestrator, which the company describes as a harness for creating a more coherent experience across its cognitive applications.
Orchestrator can use context including the business process, the user’s role and policies, and the situation in which the application is being accessed. Blue Yonder says this allows the system to determine what information should be presented, who may need to be involved, and what decision may need to be made.
This also affects the role of the traditional dashboard. Esposito described Blue Yonder’s briefing capability as a more intelligent version of a dashboard, with the objective of bringing users into the process when a higher-value judgment is required while allowing lower-level tasks to be handled by agents.
Blue Yonder is also consolidating functions including search, lookup, favorites, navigation, and interaction with agents into a more centralized access point. The company says this can reduce duplication in the interface while giving users a more consistent way to access different capabilities.
The system can also use information such as frequency of use, previous activity, and user-journey patterns to determine what is presented to the operator. According to Blue Yonder, those interactions feed back into its context graph and help Orchestrator respond more dynamically.
Extending the Experience Beyond a Single Application
Blue Yonder’s vision also extends beyond the desktop application.
Esposito said the company wants its capabilities and intelligence to be accessible wherever the user is working, including desktop systems, phones, voice-enabled environments, industrial warehouse devices, and potentially wearables. The company’s goal is to maintain continuity as users move among those environments.
That approach is already visible in Microsoft Teams. Blue Yonder has made some of its domain-agent capabilities available through Teams, allowing users to perform lookups and engage with Blue Yonder intelligence without necessarily returning to the application itself.
In logistics, Esposito pointed specifically to the logistics operations agent being available in Microsoft Teams. He described a scenario in which a procurement manager could ask about current activity and outstanding issues while remaining in Teams rather than moving back into the underlying logistics application.
This supports one of the central themes of the briefing: Blue Yonder does not believe its intelligence should be limited to a single application surface.
Warehouse Applications Put the Strategy Into Practice
The warehouse is one area where Blue Yonder has already applied this design approach.
The company has developed two role-specific mobile applications, one for warehouse operators and another for warehouse supervisors. The applications were developed using Blue Yonder’s mobile studio and were designed with industrial devices in mind.
Esposito said the warehouse effort focused on reducing clicks, maintaining application performance, and helping workers complete tasks more efficiently. Blue Yonder has also been examining measures including decision time and speed to completion as it evaluates these experiences.
The company is also introducing what it calls a decision-based workflow, or workbook. The concept is intended to give users a view of the jobs and tasks that need to be completed, while also providing context around who may be involved and where the work stands. Blue Yonder says the approach is intended to reduce cognitive load and improve collaboration.
For warehouse technology users, the relevance is fairly direct. Small reductions in clicks, navigation, or decision time can become meaningful when those interactions are repeated throughout a shift.
That is an LV interpretation rather than a specific Blue Yonder claim, but it helps explain why application design can have an operational impact in a warehouse environment.
Generative Interfaces and Cognitive Coaching
Blue Yonder is also developing concepts that go beyond simplifying existing interfaces.
One of those is the generative user interface. Esposito described a future in which interfaces could be curated more dynamically based on the information and situation at hand rather than remaining completely fixed.
The company is also developing what it calls Cognitive Coach. Blue Yonder is using information about what a user needs to do, how that user makes decisions, and who the user collaborates with to explore more personalized in-context assistance.
Esposito connected this effort to the broader issue of AI adoption and role transformation. He argued that companies need to think not only about the technology itself, but also about how jobs change as more activities are handled by agents.
Blue Yonder’s objective is to make that transition less disruptive by reducing the amount of change management required as users move from current ways of working toward more AI-assisted processes.
Managing AI Models and Consumption
The briefing also addressed how Blue Yonder manages different AI models.
Esposito said the company selects different models for different activities and can orchestrate multiple models based on the task being performed. He also noted that cost is one of the factors considered in that orchestration.
Blue Yonder is introducing a capability called Mission Hub that provides visibility into areas including the roles in the system, policies and entitlements, GenAI consumption, and which models and agents are being activated. The company said the capability will also help users understand the infrastructure cost associated with that activity.
Through GenAI Studio, customers can also choose models and establish limits or boundaries around their use. Esposito said customers are not limited to Blue Yonder automatically orchestrating those decisions for them.
This introduces a practical layer to the agentic AI discussion. As AI usage expands inside enterprise applications, customers will need visibility into which models and agents are being used and what that consumption costs.
That conclusion is analytical, but it follows directly from the capabilities Blue Yonder described.
The Larger Shift
The most important theme in the briefing was not a single application or interface feature. It was the way Blue Yonder believes the relationship between the user and the application is changing.
The company is trying to reduce manual navigation, surface decisions more directly, and allow agents to handle more of the lower-level activity surrounding those decisions. At the same time, Blue Yonder is extending those interactions across devices and collaboration environments rather than assuming that all work will take place inside one application.
Some of these capabilities are already available, while others remain in development. The company’s December releases, continued work on Cognitive Coach, and generative-interface efforts will provide additional evidence of how far this model can move from concept into day-to-day supply chain operations.
The direction, however, is clear. Blue Yonder is designing its applications around a future in which the user spends less time navigating software and more time deciding what needs attention, what can be delegated, and what action should come next.
The post Blue Yonder Is Redesigning Supply Chain Software Around Decisions, Not Screens appeared first on Logistics Viewpoints.
Non classé
Supply Chain Risk Management Is Moving From Alert Generation to Operational Response
Published
20 heures agoon
14 octobre 2026By
Executive thesis. Supply-chain risk management is moving from signal accumulation to consequence management. More alerts are not an advantage if the enterprise cannot map them to actual products, suppliers, sites, lanes, inventory, customers, or revenue.
Risk teams do not need more undifferentiated alerts
Supply chain risk platforms have become capable of collecting external signals about weather, geopolitics, suppliers, cyber events, infrastructure, finance, and other disruption sources. The challenge is that awareness does not equal response. A long queue of alerts can overwhelm the organization unless the system can determine which events intersect with real operational exposure.
Exposure mapping creates relevance
A disruption becomes actionable when it can be mapped to suppliers, sites, products, materials, lanes, customers, inventory, revenue, or service commitments. That requires multi-tier relationship data and a clear understanding of dependencies. Without that context, the enterprise may know that an event occurred but still lack a defensible answer to the question: what does this mean for us?
Prioritization should be consequence-based
Risk scoring is most effective when it helps allocate scarce attention. As a result, considering probability, exposure, time horizon, substitution options, inventory, capacity, and customer impact rather than relying on event severity alone. The same storm, port closure, or supplier issue can be immaterial to one business flow and critical to another.
Mitigation needs workflow and ownership
Once material risk is identified, the platform should support the response: investigate, validate, assign an owner, evaluate alternatives, obtain approval, execute mitigation, and track closure. Otherwise the risk platform becomes a notification system whose output has to be managed in separate tools. The value lies in shortening the path from detection to controlled action.
Scenario capability turns awareness into preparedness
Risk management improves when the organization can model alternatives before a disruption occurs. Alternate suppliers, substitute materials, inventory buffers, routes, capacity, and manual fallback can be evaluated and exercised in advance. That turns risk technology from a monitoring layer into part of the operating model for resilience.
The Logistics Viewpoints Supply Chain Risk Management Software: Buyer’s Guide evaluates external intelligence, multi-tier mapping, dependency and exposure analysis, mitigation workflow, scenarios, integrations, and alert quality as parts of one response system.
Executive implication
Risk technology should be evaluated by its ability to establish exposure, prioritize consequence, assign ownership, and accelerate executable mitigation.
Go deeper: provides the durable buyer, architecture, and implementation reference for this topic. Risk, Resilience & Security connects this analysis to the broader Logistics Viewpoints research architecture.
Related Logistics Viewpoints research
Best Practices in Supplier Risk Management
Go Deeper
Read the full Supply Chain Risk Management Software: Buyer’s Guide.
Explore the broader Risk, Resilience & Security domain for related Logistics Viewpoints research and analysis.
The post Supply Chain Risk Management Is Moving From Alert Generation to Operational Response appeared first on Logistics Viewpoints.


Can Real-Time Voice Translation Improve Warehouse Productivity and Employee Engagement?
Blue Yonder Is Redesigning Supply Chain Software Around Decisions, Not Screens
Supply Chain Risk Management Is Moving From Alert Generation to Operational Response
Freightos Global Freight Outlook – September 2026
Container rates jump another $1k/FEU – but is demand peaking? – July 8, 2026 Update

Walmart and the New Supply Chain Reality: AI, Automation, and Resilience
Trending
- Non classé1 mois ago
Freightos Global Freight Outlook – September 2026
- Non classé3 mois ago
Container rates jump another $1k/FEU – but is demand peaking? – July 8, 2026 Update
-
 Non classé2 ans ago
Walmart and the New Supply Chain Reality: AI, Automation, and Resilience
-

 Non classé6 mois ago
Why Sulfuric Acid Is Emerging as a Supply Chain Constraint in Copper
- Non classé4 mois ago
Container rates starting to spike on peak season rush – June 2, 2026 Update
- Non classé1 an ago
13 Books Logistics And Supply Chain Experts Need To Read
- Non classé12 mois ago
Ex-Asia ocean rates climb on GRIs, despite slowing demand – October 22, 2025 Update
- Non classé3 mois ago
LCL Shipping Cost Calculator: Calculate Air and Sea Shipping Freight Rates