Non classé
Securing the Chain: Mapping the Digital Supply Chain – Part 3
Published
4 mois agoon
By

Download the full guide to gain in-depth insights and practical frameworks that will help you lead the transformation towards a resilient supply chain.
You cannot secure what you cannot see. That maxim defines the central challenge of modern supply chain cybersecurity. Today’s networks are so digitally entangled, across ERP systems, cloud services, IoT devices, and countless vendors, that many executives lack a clear line of sight into their true digital footprint.
Mapping the digital supply chain is therefore a prerequisite for resilience. It allows leaders to identify dependencies, understand data flows, and pinpoint where vulnerabilities may emerge. Without it, firms are essentially flying blind in an increasingly hostile environment.
1. The Digitalization of Supply Chains
Over the last decade, physical supply chains have been mirrored by digital ecosystems.
ERP (Enterprise Resource Planning): Core platforms for managing procurement, finance, and production.
WMS (Warehouse Management Systems): Orchestrating inventory, robotics, and fulfillment.
TMS (Transportation Management Systems): Optimizing routes, carriers, and fuel usage.
IoT Sensors: Tracking location, temperature, and condition of goods in real time.
Blockchain: Creating distributed ledgers for provenance and authenticity.
AI and ML Systems: Forecasting demand, optimizing pricing, predicting disruptions.
Each new layer improves efficiency but expands the attack surface.
2. Understanding Data Flows
Executives must go beyond system inventories to map how data moves across the chain.
Procurement to Manufacturing: Supplier orders flowing into ERP and feeding into production schedules.
Manufacturing to Logistics: OT data feeding WMS and TMS platforms.
Logistics to Customers: Tracking and delivery confirmations shared across customer portals and APIs.
Cross-Border Operations: Customs clearance data passed through government systems.
Every handoff is a potential interception point.
3. Third-Party and Fourth-Party Risks
A critical blind spot lies not with a company’s direct suppliers (third parties) but with those suppliers’ suppliers (fourth parties).
Example: Your logistics provider outsources cloud hosting to a SaaS vendor, who relies on a hyperscale data center. A breach at the fourth-party level can cascade to you.
Challenge: Most firms have visibility into direct vendors but little to none into the deeper tiers.
Solution: Risk scorecards and contractual obligations that cascade security requirements down the chain.
4. Cloud and SaaS Interconnectivity
Cloud adoption has transformed supply chain IT. But with that agility comes dependency.
Multi-cloud complexity: A firm may use AWS for ERP hosting, Azure for AI analytics, and Google Cloud for IoT integration. Each has unique security profiles.
SaaS ecosystems: Platforms like Salesforce or SAP connect with dozens of apps through APIs. Misconfigured APIs are now one of the top breach vectors.
Shared tenancy: In cloud environments, sensitive data may co-exist with other tenants’ workloads, heightening risk.
5. Where Blind Spots Emerge
Mapping exercises often uncover surprises. Common blind spots include:
Legacy systems still running in the background, often unsupported and vulnerable.
Shadow IT tools and apps adopted by departments outside official IT oversight.
Supplier backdoors, remote access tools left open for convenience.
Overlapping credentials, the same login reused across multiple systems.
Executives are often shocked by how many unmonitored connections exist.
6. Framework for Mapping Digital Dependencies
A structured approach can help:
Identify: List all digital assets, ERP, SaaS, IoT, OT, APIs, data lakes.
Classify: Prioritize by criticality (e.g., systems impacting revenue vs. back-office).
Map: Create diagrams of data flows, access points, and interconnections.
Assess: Assign risk scores based on sensitivity, exposure, and vendor security posture.
Monitor: Implement continuous monitoring for changes (new suppliers, apps, or updates).
Tools like cyber digital twins can create real-time, continuously updated maps.
7. Executive Case Example
A Fortune 100 retailer recently undertook a digital mapping exercise after a near-miss ransomware attack.
The process revealed over 400 shadow applications connected to core ERP, many through unsanctioned APIs.
Several suppliers’ IoT devices were still using default credentials.
The retailer established a digital dependency map and created new contractual obligations requiring vendors to adhere to specific cyber standards.
The result: a measurable reduction in third-party vulnerabilities and increased confidence in system resilience.
8. The Role of Emerging Technologies
Blockchain & Distributed Ledgers: Provide visibility into provenance and reduce tampering but require careful security configuration.
Confidential Computing: Protects sensitive data even while in use, minimizing exposure during processing.
AI-driven Discovery Tools: Automatically scan for shadow IT, unmanaged endpoints, or rogue APIs.
These technologies enhance mapping but must themselves be secured.
9. Strategic Implications for Executives
Executives should view mapping not as a one-off project but as an ongoing strategic function.
Board reporting: Provide cyber exposure maps alongside financial reports.
M&A due diligence: Map digital supply chains of acquisition targets to uncover hidden risks.
Resilience planning: Use maps to simulate cyber disruption scenarios and their operational impacts.
This transforms cyber from a reactive IT issue into a proactive governance function.
Executive Takeaways from Part 3
Visibility precedes security. Mapping digital dependencies is foundational.
Data flows matter as much as systems. Every handoff is a risk point.
Third- and fourth-party risks are critical blind spots.
Cloud and SaaS interconnectivity multiplies vulnerabilities.
Blind spots exist everywhere, legacy, shadow IT, supplier backdoors.
Mapping is not a project but a capability. It must be embedded into ongoing strategy.
Looking Ahead
In Part 4: Governance, Compliance, and Regulation, we’ll explore how the external environment, regulators, investors, and legal frameworks, is shaping expectations for cyber resilience in supply chains.
Call to Action: Download the full guide to gain in-depth insights and practical frameworks that will help you lead the transformation towards a resilient supply chain.
The post Securing the Chain: Mapping the Digital Supply Chain – Part 3 appeared first on Logistics Viewpoints.
You may like
Non classé
Walmart AI Pricing Patents Signal Shift Toward Real-Time Retail Execution
Published
2 jours agoon
20 mars 2026By

Walmart’s new patents and digital shelf rollout point to a more tightly integrated model linking demand forecasting, pricing, and store-level execution.
Walmart has secured two patents related to automated pricing and demand forecasting, drawing attention to how large retailers are evolving their pricing and execution capabilities.
One patent, System and Method for Dynamically Updating Prices on an E-Commerce Platform, covers a system that can dynamically update online prices based on changing market conditions. A second, Walmart Pricing and Demand Forecasting Patent Classification, relates to demand forecasting technology designed to estimate what customers will buy and recommend pricing accordingly. At the same time, Walmart is expanding digital shelf labels across its U.S. stores, replacing paper labels with centrally managed electronic displays.
Individually, none of these elements are new. Retailers have long used forecasting models, pricing tools, and store execution processes. What is notable is the combination.
Walmart now has three capabilities aligned:
Demand forecasting tied to predictive models
Price recommendation based on that demand
Store-level infrastructure capable of rapid execution
That combination reduces the operational friction historically associated with pricing in physical retail.
Pricing Moves Closer to Execution
Traditional store pricing changes required coordination across multiple steps: analysis, approval, printing, distribution, and manual shelf updates. That process introduced delay and inconsistency.
Digital shelf labels materially change that constraint. Prices can be updated centrally and executed across stores with significantly less manual intervention.
This does not change the underlying logic of pricing decisions. Retailers have always adjusted prices based on demand, competition, and margin targets. What changes is the speed and consistency of execution.
As a result, pricing moves closer to real-time operational control.
Implications for Supply Chain Operations
Pricing is not an isolated commercial function. It directly influences demand patterns, inventory flow, replenishment timing, and markdown activity.
When pricing becomes faster and more responsive, those linkages tighten.
Three implications are clear:
1. Increased Execution Speed
Retailers can align pricing decisions more quickly with current demand conditions, reducing lag between signal and action.
2. Stronger Dependence on Forecast Accuracy
When pricing recommendations are driven by predictive models, the quality of demand sensing becomes more consequential. Forecast errors can propagate more quickly into sales and inventory outcomes.
3. Closer Coupling of Merchandising and Supply Chain
Pricing decisions influence demand. Demand impacts inventory, replenishment, and store execution. Faster pricing cycles compress the distance between these functions.
Centralization and Control
Walmart has positioned its digital shelf label rollout as an efficiency and accuracy initiative. Centralized price management improves consistency between systems and store execution while reducing labor tied to manual updates.
That positioning aligns with the operational realities of large-scale retail. At Walmart’s footprint, even small improvements in execution efficiency translate into material cost and accuracy gains.
At the same time, the shift toward algorithm-supported pricing introduces standard enterprise control requirements. Organizations need clear governance around how pricing recommendations are generated, reviewed, and executed, particularly as systems become more automated.
A Broader Technology Pattern
Walmart’s patents are best understood as part of a broader shift in supply chain and retail technology.
AI and advanced analytics are moving closer to operational decision points. Forecasting models are no longer confined to planning environments; they are increasingly connected to systems that can act.
In this case, that connection spans:
Demand sensing
Price recommendation
Store-level execution
The result is a more tightly integrated operating model in which commercial decisions and supply chain execution are linked through software.
What This Signals
The significance of Walmart’s move is not tied to public debate over surge pricing scenarios. The underlying development is structural.
Retailers now have the ability to connect demand forecasting, pricing logic, and execution infrastructure into a faster decision loop.
For supply chain leaders, that represents a clear direction:
Execution is becoming more digital, more centralized, and more tightly coupled to predictive models.
The companies that benefit will be those that can align forecasting, pricing, and operational execution within a controlled, coordinated system.
The post Walmart AI Pricing Patents Signal Shift Toward Real-Time Retail Execution appeared first on Logistics Viewpoints.
Non classé
Supply Chain and Logistics News March 16th-19th 2026
Published
2 jours agoon
20 mars 2026By

This week’s installment of Supply Chain and Logistics news includes stories about record increases in oil prices, Rivian’s autonomous taxis, and much more. Firstly, the Trump administration has issued a 60-day waiver of the Jones Act, a century-old regulation that requires goods moved between US ports to be transported by US-built vessels, etc. Additionally, this week Uber & Rivian announced a partnership for Rivian to build 50,000 autonomous robotaxis by 2031 with over a billion dollars in investment from Uber. Schneider Electric and EcoVadis announced a partnership to target emissions in the health care sector. Lastly, DHL announces 10 warehousing sites to be used for data center manufacturing capacity, and Mind Robotics raises 100 million in series A funding.
Your Biggest Stories in Supply Chain and Logistics here:
Trump Administration Issues Pause on Century-old Maritime Law to Ease Oil Prices
The Trump administration has issued a 60-day waiver of the Jones Act. This century-old regulation typically requires goods moved between US ports to be carried on vessels that are US-built, US-owned, and US-crewed. However, with oil prices surging toward $100 a barrel due to escalating conflict in the Middle East, the suspension aims to ease logistics for vital commodities like oil, natural gas, and fertilizer. While the move is intended to lower costs at the pump and support farmers during the spring planting season, it has sparked a debate between those seeking immediate economic relief and domestic maritime unions concerned about the long-term impact on American shipping and labor.
Uber and Rivian Partner to Deploy up to 50,000 Fully Autonomous Robotaxis
Uber and Rivian have announced a massive strategic partnership that signals a major shift in the future of autonomous logistics and urban mobility. Under the terms of the deal, Uber is set to invest up to $1.25 billion in Rivian through 2031, a move specifically tied to the achievement of key autonomous performance milestones. The primary focus of this collaboration is the deployment of a specialized fleet of fully autonomous R2 robotaxis, with an initial order of 10,000 vehicles and an option to scale up to 50,000 units. From a supply chain perspective, this represents a significant commitment to vertical integration; Rivian is managing the end-to-end production of the vehicle, the compute stack, and the sensor suite, including its in-house RAP1 AI chips, while Uber provides the scaled platform for deployment. Commercial operations are slated to begin in San Francisco and Miami in 2028, eventually expanding to 25 cities globally by 2031.
Schneider Electric and EcoVadis Announce Partnership to Decarbonize Global Healthcare Supply Chains
Schneider Electric, a major player in the digital transformation of energy management and automation, and EcoVadis, a provider of business sustainability ratings, have announced a strategic partnership aimed at accelerating decarbonization within the healthcare industry. “Energize” is a collective initiative to engage pharmaceutical industry suppliers in climate action. The collaboration focuses on addressing Scope 3 emissions, those generated within a company’s value chain, which often represent the largest portion of a healthcare organization’s carbon footprint. By combining Schneider Electric’s expertise in energy procurement and sustainability consulting with EcoVadis’s supplier monitoring and rating platform, the partnership provides a structured pathway for pharmaceutical and medical device companies to transition their global suppliers toward renewable energy.
Mind Robotics, a Rivian spin-off, raises $500 million in Series A Funding
RJ Scaringe, CEO of Rivian, is positioning his new $2 billion spin-off, Mind Robotics, as a technological solution to the chronic shortage of manufacturing labor in the Western world. By developing a “foundation model” that acts as an industrial brain alongside specialized mechatronic bodies, the company aims to move beyond the rigid, fixed-motion plans of traditional robotics toward systems capable of human-like reasoning and adaptation. Scaringe emphasizes that while these machines must perform with human-level dexterity, they don’t necessarily need to be humanoid in form; instead, the focus is on creating a data-driven “flywheel” within Rivian’s own facilities to lower production costs and help domestic manufacturing remain globally competitive.
DHL is significantly scaling its data center logistics (DCL) footprint in North America, announcing the addition of 10 dedicated sites totaling over seven million square feet of warehousing capacity. This expansion is a direct response to the explosive demand for AI-driven infrastructure and the specific needs of hyperscale and colocation data center operators. By offering specialized services like rack pre-configuration, white-glove handling of sensitive IT hardware, and warehouse-to-site transportation, DHL is positioning itself as an end-to-end partner in a sector where 85% of operators express a preference for a single logistics provider. This move not only addresses the logistical complexities of moving high-value components like GPUs and cooling systems across global borders but also underscores the critical role of integrated supply chains in maintaining the build speed of the digital backbone.
Song of the Week:
The post Supply Chain and Logistics News March 16th-19th 2026 appeared first on Logistics Viewpoints.
Non classé
How to Capitalize Quickly to Address Hyperconnected Industrial Demand
Published
2 jours agoon
19 mars 2026By
This first in a blog series offers a review of discussion that occurred during ARC Advisory Group’s 2026 Industry Leadership Forum. Specifically, it details a keynote conversation held with senior executives from Rolls-Royce, BTX Precision, and MxD.
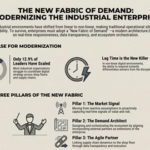
The New Fabric of Demand: Modernizing Collaboration and Transparency for Real-Time Production
Industrial leaders have been talking about tearing down workflow and data silos for decades. Yet here we are again. For most, the reality is that most operations and supply chains today typically don’t indicate much progress. A few leaders have figured out how to use digital tools to scale and build pathways forward, a whopping 12.9% according to our latest data (yes, that’s sarcasm). However, even as they struggle to coordinate, orchestrate, and innovate across their operations and enterprise, much less tightly collaborate outside their four walls. In a digital world, this continued capability gap, the inability to closely link market signals to responsive production and external supply chains, is very quickly becoming a liability.
Recently, at the 30th Annual ARC Industry Leadership Forum in Orlando, I had the privilege of leading a keynote discussion entitled The New Fabric of Demand: Modernizing Collaboration and Transparency for Real-Time Production. As part of that, I moderated an excellent conversation that included Global Commodity Executive Greg Davidson of Rolls-Royce, CEO Berardino Baratta of MxD, and CRO Jamie Goettler of BTX Precision.
In this four-part series, we will explore that conversation fully, digging into how the “fabric of market demand” has fundamentally changed, and why structural modernization, both human and technological, is no longer just an option. It is an industrial imperative that will increasingly determine who wins in disrupted markets.
Why Legacy Workflow Will Actually Get Modernized
If we examine the present through the lens of the past, the fundamental laws of supply and demand haven’t really changed. What has changed is the hyperconnectivity of the world and our compressed time to both reward and volatility.
The hard truth is that legacy linear workflows simply do not work in hyperconnected, digitally-driven environments, which are non-linear by nature. As our industrial environments become more digital, they naturally open up countless new ways for how things can get done and how risk can enter the organization. As a result, disruption has shifted from a rare event to a fairly continuous and pervasive reality. In this new reality, responsiveness differentiates you from the competition, and lag time kills.
To survive and thrive in non-linear environments, tighter, integrated ecosystems are required, where silos are actively torn down or redesigned so that barriers to value can be continuously identified and quickly eliminated. At the core, this concept is unfolding around data access, contextualization, and sharing. It provides the urgency behind the need for building industrial data fabrics.
This rewiring certainly extends beyond operations and enterprise processes, enabling the entirety of the supply chain to be judged on its collective responsiveness to the market, all the way down to the individual company level. In this scenario, data can quickly point out laggards who limit value. As the orchestrators of these supply chains identify these limitations on value, they quickly break off and discard the connection and move on without these weak links.
Pillars of the New Fabric of Demand
To achieve necessary level of operational and supply chain responsiveness, the roles of every entity within an ecosystem must be rethought. In the subsequent three blogs of this series, we will take a deep dive into the three distinct pillars that make up this modern architecture, but I’ll begin by laying them out here:
The Market Signal is the catalyst of the entire ecosystem. It dictates the “what” and the “when,” defining what value, success and risk look like in real-time. In blog 2, I’ll explore how to move from reactive assumptions to proactively capturing the market signals that actually matter.
The Demand Architect is moving beyond traditional order-taking. The Demand Architect designs and orchestrates the ecosystem, aligning external partners as true extensions of the enterprise. In blog 3, I’ll discuss the structural agility required to lead this response, rather than just manage a process.
The Agile Partner is the engine of execution. The Agile Partner links supply chain dynamics directly to the shop floor, differentiating themselves through their responsiveness to the market signal. In the final blog in the series, I’ll tackle how data transparency and trust become technical requirements, not just buzzwords, without exposing mission-critical IP.
Building the Modern Industrial Enterprise
Legacy workflows cannot survive in a non-linear world. Industrial organizations must re-architect operations and ecosystems for real-time responsiveness and secure, transparent collaboration. To do so, they will need to:
Improve the measurement of responsiveness: Efficiency and margin-squeezing are important, but they aren’t game-changers. Your competitive edge now relies on how quickly you can adapt to market signals.
Embrace transparency over secrecy: Modern collaboration requires providing a contextualized “lens” into production status without compromising proprietary IP or cybersecurity. Industrial data fabrics are key.
As always, view technology as a tool, not an outcome: Industrial data fabrics are needed to break silos and AI to manage complexity and improve accuracy and speed of decisions. However, the age-old adage remains true. Just because you can apply AI to something doesn’t mean you should. It must be grounded in measurable Value on Investment (VOI), not just return.
The New Fabric of Demand Blog Series
This is the first in a series of four on The New Fabric of Demand: Modernizing Collaboration and Transparency for Real-Time Production. Over the coming days, I’ll publish a perspective from each of the three pillars of the new fabric of demand:
Pillar 1: The Market Signal
Pillar 2: The Demand Architect
Pillar 3: The Agile Partner
By Mike Guilfoyle, Vice President.
For more than two decades, Michael has assisted organizations, including numerous Fortune 500 companies, in identifying and capitalizing on growth opportunities and market disruption presented by the effects of digital economies, energy transition, and industrial sustainability on the energy, manufacturing, and technology industries.
The post How to Capitalize Quickly to Address Hyperconnected Industrial Demand appeared first on Logistics Viewpoints.


Walmart AI Pricing Patents Signal Shift Toward Real-Time Retail Execution

Supply Chain and Logistics News March 16th-19th 2026

How to Capitalize Quickly to Address Hyperconnected Industrial Demand

Walmart and the New Supply Chain Reality: AI, Automation, and Resilience
Ex-Asia ocean rates climb on GRIs, despite slowing demand – October 22, 2025 Update
13 Books Logistics And Supply Chain Experts Need To Read
Trending
-
 Non classé1 an ago
Walmart and the New Supply Chain Reality: AI, Automation, and Resilience
- Non classé5 mois ago
Ex-Asia ocean rates climb on GRIs, despite slowing demand – October 22, 2025 Update
- Non classé7 mois ago
13 Books Logistics And Supply Chain Experts Need To Read
- Non classé2 mois ago
Container Shipping Overcapacity & Rate Outlook 2026
- Non classé4 mois ago
Ocean rates climb – for now – on GRIs despite demand slump; Red Sea return coming soon? – November 11, 2025 Update
- Non classé1 an ago
Unlocking Digital Efficiency in Logistics – Data Standards and Integration
- Non classé1 mois ago
Ocean rates ease as LNY begins; US port call fees again? – February 17, 2026 Update
-

 Non classé7 mois ago
Blue Yonder Acquires Optoro to Revolutionize Returns Management