
Non classé
The Global Refining Network Is Becoming a Logistics Chokepoint

Published
2 mois agoon
By
The conflict involving Iran and the continuing Russia-Ukraine war are exposing a supply-chain vulnerability that receives far less attention than crude oil production: the global refining and petroleum logistics network.
The world can have crude oil available and still experience shortages of diesel, jet fuel, marine fuels and petrochemical feedstocks if it cannot move that crude to the right refineries, process it into the products customers actually consume and then move those products to the markets where they are needed. In 2026, that distinction has become increasingly important. The problem facing the global economy is no longer simply the availability of oil. It is the network capacity required to transform and deliver it.
That network is more concentrated than many supply-chain executives may realize. Oil & Gas Journal has counted roughly 575 active refineries across 107 countries, while OPEC reports that global refining capacity stood at 103.66 million barrels per day in 2025, with actual refinery throughput averaging 86.89 million barrels per day. The refining industry has simultaneously been shifting toward larger and more sophisticated facilities, particularly in China, India and the Middle East, while older capacity has closed in parts of Europe and other mature markets.
That evolution makes economic sense. Large refineries gain tremendous efficiencies through scale, process integration and sophisticated conversion technology. But supply-chain practitioners will immediately recognize the tradeoff. Greater concentration means more volume moving through fewer nodes, increasing the consequence when one of those nodes, or the transportation infrastructure connecting it to the rest of the network, is disrupted.
In 2026, two different wars are testing that architecture simultaneously.
Crude Oil Is Only the First Step
Supply-chain discussions about energy frequently focus on the upstream market: production levels, OPEC decisions, oil reserves and the price of Brent crude. Yet crude oil is essentially an industrial input. The physical economy consumes what refineries manufacture from it.
Trucks need diesel. Aircraft require jet fuel. Ships consume marine fuels. Construction and mining equipment depend heavily on middle distillates. Petrochemical plants require LPG, naphtha and other hydrocarbon feedstocks that ultimately become plastics, packaging, fibers, coatings and industrial chemicals.
The relevant supply chain therefore looks something like this:
Production field → pipeline → export terminal → tanker → import terminal → refinery → storage terminal → pipeline, ship, rail or truck → distributor → end user
A disruption at any one of those nodes can constrain the entire system.
Refineries themselves also are not perfectly interchangeable. Crude grades differ substantially in density, sulfur content and chemical characteristics. Refinery configurations determine how efficiently facilities can process those grades and the mix of products they can make. Replacing one million barrels per day of lost refinery throughput is therefore not necessarily a matter of finding another refinery somewhere in the world with one million barrels per day of nominal spare capacity.
The replacement refinery has to be able to obtain an appropriate feedstock, process that crude efficiently, produce the required product specification and connect to a transportation system capable of moving the output to the demand location.
This is where the refinery story becomes a logistics story.
The Real Constraint Is the Network
The importance of that distinction has become particularly evident in the Middle East.
The Strait of Hormuz is usually described as an oil chokepoint, and for good reason. But treating it purely as a crude-oil chokepoint understates the supply-chain exposure. Gulf countries are also major producers and exporters of refined petroleum products, LPG and petrochemical feedstocks.
Before the current conflict, Gulf producers exported approximately 3.3 million barrels per day of refined products and another 1.5 million barrels per day of LPG. When flows through Hormuz collapsed earlier this year, more than 3 million barrels per day of regional refining capacity shut down because of attacks or because facilities lacked viable outlets for their products. The International Energy Agency estimated that more than 4 million barrels per day of refining capacity was potentially at risk as product tanks filled and export routes became constrained.
That demonstrates an important logistics principle: physical production capacity and usable production capacity are not the same thing.
A refinery does not need to suffer direct physical damage to become constrained. If crude cannot reach the refinery, it loses feedstock. If tankers cannot load its products, storage eventually fills. Once tanks approach capacity, refinery runs must be reduced even if every processing unit remains operational.
Transportation capacity can therefore determine manufacturing capacity.
That phenomenon is familiar elsewhere in supply chains. A factory capable of producing 10,000 units per day does not provide 10,000 units of effective capacity if inbound components arrive for only 6,000 units or outbound transportation can move only 7,000. Refining is no different, except that the volumes are measured in millions of barrels and the transportation network spans continents.
Refinery Capacity Is Becoming More Concentrated
The structure of that network has also been changing for years.
Oil & Gas Journal noted that the number of refineries had declined even as global refining capacity increased, reflecting expansions at existing plants and the construction of larger facilities. OPEC estimated global capacity at more than 103 million barrels per day in 2025, with additions increasingly concentrated in non-OECD markets such as China, India and the Middle East.
That creates a supply-chain architecture increasingly dependent on large industrial nodes and long transportation lanes. Crude may travel thousands of miles to reach a sophisticated export refinery, after which diesel, jet fuel or petrochemical feedstocks may travel thousands of additional miles to consuming markets.
This is not fundamentally different from what has occurred in semiconductors, battery materials or critical-mineral processing. Scale and specialization drive efficiency, but they also concentrate risk.
The Middle East conflict is now stressing both the manufacturing nodes and the transportation lanes simultaneously.
Hormuz Has Become a Transportation-Capacity Problem
Perhaps the clearest illustration is what has happened in tanker logistics.
As conventional export routes have been disrupted, producers have increasingly relied on alternative pipelines, ports and ship-to-ship transfers. Those alternatives have prevented a complete collapse in Gulf exports, but they have also created secondary bottlenecks.
Saudi Arabia’s East-West Pipeline is a particularly important example because it allows crude from the Persian Gulf region to move across the country to the Red Sea port of Yanbu, bypassing Hormuz. That pipeline itself was subsequently attacked and shut down in September, temporarily eliminating one of the most important alternative routes around the original chokepoint.
Operations have now restarted. On September 29, Reuters reported crude loadings at Yanbu at about 2 million barrels per day, while Kpler estimated pipeline throughput at about 2.65 million barrels per day. Throughput could climb toward 3 million to 4 million barrels per day relatively quickly, but a return to the pre-attack rate of approximately 5.5 million barrels per day may take another month.
From a logistics perspective, this is exactly what redundancy is supposed to accomplish. An alternative route absorbs volume when the primary lane becomes unavailable. But redundancy only works to the extent that the backup itself has sufficient capacity and remains operational.
When Yanbu became constrained, more volume shifted back toward marine movements and ship-to-ship transfers in the Gulf of Oman. By late September, more than 60 million barrels of Saudi crude had reportedly been sold for ship-to-ship transfer near Sohar, Oman. Saudi exports moving through Hormuz were expected to increase from about 900,000 barrels per day in August to 3.6 million barrels per day in September, requiring an additional 36 to 40 very large crude carriers.
The result was predictable. Tanker availability tightened, congestion increased and VLCC charter rates reportedly reached approximately $1.27 million per day. Buyers began looking at alternative transfer locations farther away, including India and Malaysia.
This is textbook transportation economics. When a major lane loses capacity, freight diverts to alternatives. Those routes then become congested. Transit times rise. Assets spend more time waiting and less time moving. Even if the number of tankers in the fleet has not changed, effective transportation capacity declines because equipment cycle time increases.
In petroleum logistics, a tanker is also inventory in motion. A longer voyage means the same ship can complete fewer rotations in a month, tying up both transportation capacity and millions of barrels of working inventory.
Russia Is Creating a Second Product-Supply Shock
The Middle East would be a significant problem on its own. It is not occurring on its own.
Ukraine has increasingly targeted Russian refinery infrastructure, while Russia continues attacking Ukrainian energy and industrial infrastructure. The cumulative effect on Russian refining has become significant enough to affect international product markets.
Russia extended restrictions on diesel exports through September after repeated attacks left refineries offline and domestic fuel supplies tight. Russia is one of the world’s largest diesel exporters, meaning reductions in Russian output immediately shift demand toward alternative suppliers.
The physical damage has continued as well. Russia’s Perm refinery, the country’s seventh largest by processing volume, stopped operating following a September 25 drone strike that damaged pipelines, storage equipment and other infrastructure. The refinery processed approximately 12.6 million metric tons of crude in 2024 and produced around 5.3 million tons of diesel and 2 million tons of gasoline.
From the perspective of the global logistics network, the important issue is what happens next. If a Russian refinery produces less diesel and exports are restricted, buyers that previously sourced Russian barrels must obtain replacement supply from somewhere else. Turkey, Brazil or another importer may turn to U.S., Indian, Middle Eastern or other refining centers.
Those replacement barrels often travel longer routes. They require additional tanker capacity. They compete against existing customers of those suppliers. And they draw inventories from regions that may themselves have relatively limited buffers.
A refinery outage in Russia therefore becomes a tanker-capacity problem in the Atlantic Basin, an inventory problem in Europe or Latin America, and potentially a pricing problem for trucking fleets thousands of miles away.
That is what interconnected supply chains do: they propagate constraints.
Diesel Shows How Quickly the Problem Spreads
The September IEA Oil Market Report makes the scale of the problem unusually clear.
Global refinery throughput reached 81.4 million barrels per day in August, but remained 4.2 million barrels per day below the previous year. The IEA now expects worldwide refinery runs to decline by 2.6 million barrels per day in 2026, to an average 81.5 million barrels per day.
The product-market consequences are even more striking. Refined-product and LPG exports from Gulf countries remained approximately 3.7 million barrels per day, or nearly 60%, below February levels. Gulf diesel and gasoil exports averaged just 390,000 barrels per day in August, slightly more than one-quarter of their prewar rate.
When Russia is added to that equation, the logistics impact becomes much larger. The IEA calculates that Gulf and Russian diesel and gasoil exports in August were 1.6 million barrels per day below February levels. Before the disruptions, those two sources represented nearly 45% of global seaborne diesel trade.
That is not simply a fuel-price story.
Diesel sits underneath much of the physical economy. It powers long-haul trucking, construction equipment, agricultural machinery, mining operations, backup generators and a substantial portion of marine and industrial activity.
When internationally traded diesel becomes scarce, the immediate response is a global repositioning exercise. Importers search for substitute barrels. Refiners increase utilization where they can. Product tankers travel different routes. Cargoes are redirected toward the highest-paying markets. Inventories fall in exporting countries while importing countries compete for replacement supply.
The United States has increasingly become one of those balancing suppliers. Reuters reported in September that U.S. diesel exports had risen more than 20% from 2025 levels to approximately 1.3 million barrels per day as American refiners helped replace missing Middle Eastern and Russian supply. At the same time, U.S. inventories fell to their lowest seasonal levels in decades.
That creates an uncomfortable supply-chain feedback loop. The more aggressively one region fills a global shortage, the more it can reduce its own inventory buffer.
Inventories Are Safety Stock at Global Scale
Supply-chain practitioners should recognize another familiar concept in what has happened this year: safety stock.
Commercial fuel inventories and strategic petroleum reserves perform much the same role that safety inventory performs in a manufacturing or distribution network. They absorb temporary disruptions, allowing demand to continue while the underlying supply problem is corrected.
Those buffers have been heavily used.
The IEA reported that global observed oil inventories fell another 95 million barrels in August, bringing cumulative draws since February to 507 million barrels, equivalent to an average draw of 2.8 million barrels per day.
Earlier in the year, IEA countries had agreed to make 400 million barrels of emergency reserves available in response to disruptions stemming from the Middle East conflict.
Inventories, however, do not create permanent production capacity. They buy time.
A distribution center can survive a supplier outage for several weeks if it has sufficient safety stock, but eventually either supply must resume or demand must be reduced. Petroleum markets operate according to the same logic, only on a far larger scale.
Europe Demonstrates the Cost of Transportation Dependence
Europe provides another illustration of what happens when local production capacity declines and dependency shifts toward international logistics.
The United Kingdom has gone from six operating refineries in 2024 to four today. Diesel imports represented nearly 40% of UK petroleum-product imports in 2025, according to figures cited by Reuters. With international diesel markets tightening, UK diesel prices reached a record 199.18 pence per liter in late September.
This is an important distinction for supply-chain strategy. Shutting a domestic production facility does not eliminate demand. It changes the mechanism by which demand is satisfied.
Local manufacturing dependence becomes import dependence.
Import dependence becomes tanker dependence.
Tanker dependence creates exposure to freight rates, insurance, port capacity, trade policy, geopolitical chokepoints and longer replenishment lead times.
The economics may still justify the original refinery closure. But the risk profile has fundamentally changed.
The Impact Extends Beyond Trucking
Diesel may provide the clearest connection to logistics, but the effects extend further.
Jet fuel markets are also tight. On September 29, Lufthansa said the additional effect of higher fuel costs during 2026 would exceed its previous estimate of €1.5 billion. Fuel accounts for approximately 30% to 40% of airline operating expenses, giving higher jet-fuel prices a direct route into both passenger aviation and air-cargo economics.
Petrochemicals add another layer. Earlier in the conflict, reduced Gulf availability of LPG and naphtha forced some petrochemical producers to curb polymer production. These materials feed downstream industries ranging from packaging and automotive components to consumer products and industrial chemicals.
A manufacturer does not need to purchase diesel directly to be exposed to refinery disruptions. Its transportation providers purchase fuel. Its packaging suppliers purchase resins. Its chemical suppliers purchase refinery or gas-processing feedstocks. Its airfreight providers purchase jet fuel.
Petroleum exposure exists several tiers upstream in almost every physical supply chain.
This Is a Network-Design Problem
This is ultimately why the refinery story belongs on a logistics site rather than only in an energy-market discussion.
The challenge can be described through four familiar supply-chain variables: node capacity, lane capacity, inventory and substitution time.
Refineries provide node capacity. Pipelines, tankers and terminals provide lane capacity. Commercial stocks and strategic reserves provide inventory buffers. Alternative crude grades, refineries, shipping routes and suppliers provide substitution options.
The Iran conflict and the Russia-Ukraine war are applying pressure to all four at the same time.
Some refinery capacity is unavailable. Some transportation lanes are constrained. Tanker cycle times and costs have increased. Inventory buffers are being drawn down. And substitution is neither instantaneous nor frictionless because refineries, crude grades, fuel specifications and logistics networks are not perfectly interchangeable.
The result is a system in which relatively small disruptions can cascade through multiple markets.
That is exactly how complex supply networks behave when highly utilized nodes become concentrated and buffers decline.
Refineries Belong on the Global Supply-Chain Chokepoint Map
Over the past several years, supply-chain executives have learned that infrastructure previously viewed as someone else’s concern can quickly become operationally strategic.
Semiconductor fabs became supply-chain infrastructure during the chip shortage. The Suez Canal became supply-chain infrastructure when a single container ship blocked it. The Panama Canal became supply-chain infrastructure when drought constrained vessel transits. Rare-earth processing facilities became supply-chain infrastructure when companies realized that where minerals are processed can matter as much as where they are mined.
Refineries deserve the same treatment.
The world has roughly 575 active refineries, and refining capacity has increasingly migrated toward large, sophisticated facilities connected to international crude and product markets. That architecture generates tremendous efficiency, but it also means that a disruption in a comparatively small number of places can affect transportation and manufacturing networks across multiple continents.
The current Middle East conflict is stressing one of the world’s most important energy-production and transportation corridors. The Russia-Ukraine war is simultaneously reducing output from another major refining center. Tankers are being rerouted. Ship-to-ship transfer locations have become congested. Alternative pipelines have themselves become targets. Diesel exports from key regions have fallen dramatically, and inventories are absorbing the difference.
The question for supply-chain executives is therefore no longer simply whether there is enough crude oil in the world.
The more useful question is whether the network has sufficient refining capacity, transportation capacity, inventory and routing flexibility to convert that crude into the right products and deliver those products to the right markets at the right time.
That is the logistics problem emerging from the energy disruptions of 2026.
And it is a reminder of a broader principle that supply chains repeatedly rediscover: available supply is not the same thing as deliverable supply.
The post The Global Refining Network Is Becoming a Logistics Chokepoint appeared first on Logistics Viewpoints.
You may like
Non classé
Loftware Acquires Seagull Software from Peak Rock Capital
Published
5 heures agoon
16 novembre 2026By
Loftware, a provider of product identification and labeling solutions, has acquired Seagull Software from an affiliate of Peak Rock Capital. The transaction brings together two companies focused on enterprise labeling, product identification, and supply chain traceability.
Seagull Software, headquartered in Redmond, Washington, provides labeling and item-level tracking solutions through its flagship BarTender platform. The software enables organizations to design, manage, print, and automate labels, barcodes, RFID tags, and other product identifiers used throughout manufacturing, distribution, and logistics operations.
Seagull serves thousands of customers across 160 countries through a global network of channel partners. Its technology supports the production of billions of labels and identifiers used for inventory management, regulatory compliance, product tracking, and supply chain execution.
Growth Under Peak Rock Ownership
Peak Rock acquired Seagull from its founders in 2022 and subsequently supported an expansion of the company’s product portfolio, sales organization, and recurring revenue business model.
During Peak Rock’s four-year ownership period, Seagull tripled its annual recurring revenue. The company also expanded its capabilities in supply chain traceability and invested in research and development, customer success, and international sales operations.
Product investments included AI-enabled label design and inventory analytics capabilities, extending Seagull’s offerings beyond traditional label creation and printing.
Jared Mason, Managing Director of Peak Rock, said the company had successfully transitioned toward a recurring revenue model while expanding its global sales organization and introducing additional AI capabilities.
Expanding Product Identification and Traceability
The acquisition places Seagull within Loftware’s product identification portfolio. Loftware is backed by private equity firms Accel-KKR and RS2 Healthcare Partners, formerly Riverside Partners.
Seagull’s BarTender platform supports organizations seeking to standardize labeling processes, automate identification workflows, and improve product traceability across distributed operations.
Jeff Hart, Chief Executive Officer of Seagull, credited Peak Rock with providing the resources to accelerate growth and expand the company’s ability to serve customers.
The transaction represents Peak Rock’s fourth recent sale from its software investment portfolio. According to the firm, it has now exited all software investments made before opening its fourth fund in 2025.
Financial terms of the transaction were not disclosed.
Raymond James and William Blair & Company served as financial advisors, while Kirkland & Ellis LLP provided legal counsel to Seagull.
The post Loftware Acquires Seagull Software from Peak Rock Capital appeared first on Logistics Viewpoints.
Heading into 2027, shifting carrier alliances, capacity returning to the Red Sea, and frequent rate and surcharge fluctuations make structured rate management essential to protecting your margins.
Join Judah Levine (Head of Research) for an exclusive breakdown of where ocean markets are heading next, followed by a live look at how forwarders use Rate & Quote Ocean to view non-digitized carrier contracts clearly, compare multiple carriers side-by-side, and eliminate costly invoice discrepancies.
What we’ll cover:
2027 Ocean Market Outlook: Key rate drivers, capacity shifts, and spot volatility trends with Judah Levine.
Digitized Contract Clarity: View non-digitized carrier agreements, 10-tab spreadsheets, and unmarked PDFs in a single, searchable digital format without folder-digging.
Multi-Carrier & Spot Comparisons: Compare contracted rates across multiple carriers side-by-side alongside live terminal and dynamic spot data on one screen.
Exclusive Live Attendee Offer: Unlock the chance to grab a quick 15 minutes with our team to see how your own carrier spreadsheets and tariffs look digitized inside the platform.
Can’t attend live? Register anyway and we’ll send the recording straight to your inbox.
The post 2027 Ocean Market Outlook appeared first on Freightos.
Non classé
From Material Flow to Machine Judgment: How Physical AI Connects Production Logistics to Autonomous Operations
Published
12 heures agoon
16 novembre 2026By
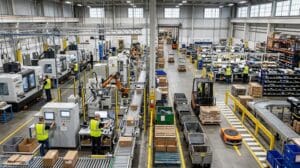
From Material Flow to Machine Judgment: How Physical AI Connects Production Logistics to Autonomous Operations
Walk any modern plant floor and you’ll see two different worlds. On one side are the production assets: CNC cells, assembly lines, test stations and packaging lines. Each one is heavily instrumented and tuned to the second. On the other side is everything that moves material between them: tuggers, forklifts, AMRs, conveyors, kitting stations and line-side supermarkets.
For decades these two worlds have been planned separately and run separately. They’ve been joined by a fragile layer of schedules, kanban cards, radio calls and heroic shift supervisors. The result is familiar. A line starves because a kit arrived 12 minutes late. A buffer overflows because upstream ran ahead of plan. A changeover stalls because the right fixtures are still on the far side of the building.
Here is the central argument of this column: manufacturers won’t reach true autonomous operations by automating the machines alone. They’ll get there when production logistics becomes as intelligent, perceptive and adaptive as the production process it feeds. Physical AI is the technology that finally makes that possible.
What We Mean by “Physical AI”
Most of the AI conversation over the past few years has been about language: copilots, chatbots and document summarization. Physical AI is different. It’s AI that perceives, reasons about and acts in the physical world. It combines four layers:
Perception: vision, LiDAR, force-torque and other sensors that let machines understand a changing, unstructured environment.
World models and simulation: physics-based digital twins where robots and material flows are trained and tested virtually before they touch the real floor.
Embodied decision-making: models that turn perception into motion, such as a path, a grasp or a hand-off, in milliseconds and at the edge.
Fleet-level orchestration: coordination across many heterogeneous agents (mobile robots, arms, conveyors and humans) toward one production goal.
Traditional automation does exactly what it was programmed to do. Physical AI handles what it wasn’t programmed for: the misplaced pallet, the deformed tote, the operator stepping into an aisle, the rush order that rewrites the afternoon.
The Missing Link: Why Logistics Is the Bottleneck to Autonomy
Manufacturers have spent heavily on making individual production assets smarter through predictive maintenance, closed-loop quality and adaptive process control. But a smart machine waiting for material is still an idle machine. Three failure patterns keep intralogistics from supporting autonomous operations.
1. The Schedule-Reality Gap
MES and ERP systems plan material movement against an idealized schedule, and the floor never matches that schedule. Fixed-route AGVs and milk runs can’t re-plan when a line speeds up, slows down or switches products. Each deviation travels downstream as either starvation or congestion.
2. The Perception Blind Spot
Most material handling still “sees” the plant through barcodes and RFID checkpoints. Between scans, the system doesn’t know where inventory really is or what condition it’s in. Autonomy can’t exist on top of partial situational awareness.
3. The Islands of Automation Problem
A plant may run AMRs from one vendor, AGVs from another, robotic palletizers from a third and a homegrown conveyor control system. Each is optimized locally, and none negotiates with the others. Local efficiency becomes system-level friction.
Until these gaps close, “lights-out” or “autonomous” manufacturing stays a slide in a strategy deck and never becomes an operating reality.
How Physical AI Closes the Loop
Physical AI connects production logistics to autonomous operations through four capabilities that build on each other.
1. Perception-Driven Material Awareness
Vision-equipped mobile robots, overhead cameras and smart sensors continuously map where material is, not where the system thinks it is. Inventory turns into a live spatial data stream instead of a series of transaction records. A shortage at line-side is detected when it starts to form, not when the line stops.
2. Simulation-Trained, Edge-Executed Intelligence
Robots and flow logic are trained in physics-accurate digital twins of the facility, covering layouts, traffic patterns, product mix and the edge cases that would be dangerous or expensive to test live. The resulting models are deployed to the edge, where they make path, grasp and hand-off decisions locally without waiting on a distant cloud. As Week 12 argued, that latency matters: a robot that has to ask permission for every move isn’t autonomous.
3. Demand-Sensing Material Flow
This is where logistics and production merge. When the production system signals a change, such as a faster takt, a quality hold or an unplanned changeover, the material flow responds on its own. Kits are re-sequenced, AMRs are re-tasked and buffers are rebalanced. Replenishment stops being a scheduled event and becomes a continuous, demand-sensing reflex.
4. Multi-Agent Orchestration Across the Value Stream
The end state isn’t one smart robot. It’s a coordinated fleet in which mobile robots, manipulators, conveyors, automated storage and people work as one system. Open interoperability standards such as VDA 5050 for mobile robot fleets, along with vendor-neutral orchestration layers, let mixed fleets negotiate priorities, resolve traffic conflicts and share tasks. Production logistics becomes an active participant in running the plant, not a support function.
A Day in the Autonomous Plant
Picture a discrete manufacturer running a mixed-model assembly line:
06:40. An inline vision system flags a supplier defect on a component batch, and the quality agent places the batch on hold.
06:41. The orchestration layer re-sequences production to models that don’t use the affected component. Within seconds, the material flow agents re-plan kitting: AMRs pull alternate kits from storage, and a robotic cell re-picks sub-assemblies for the new sequence.
06:45. A changeover begins on Line 2. Fixtures and tooling are already staged, because the logistics fleet saw the sequence change and pre-positioned them.
06:52. A supervisor gets one consolidated notification with the root cause, the actions taken and a recommended supplier escalation, and approves the escalation.
No line stopped. Nobody ran across the building with a clipboard. The decisions that needed human judgment (the supplier escalation) went to a human. The decisions that needed speed (re-routing, re-kitting, re-staging) were made by machines.
That’s autonomous operations: not the absence of people, but the absence of avoidable friction between production and the material that feeds it.
Autonomy With Guardrails: Safety Comes Before Speed
Autonomy isn’t the same as abdication. Physical AI puts moving mass, tooling and people in the same space, and the safety stakes are far higher than for a chatbot answering a question. Manufacturers getting this right follow a few clear principles.
Bounded autonomy. AI agents work inside hard-coded safety envelopes. Learning systems optimize within constraints and never override deterministic safety functions such as safety-rated controllers, light curtains and certified speed and separation monitoring.
Hierarchical control. Adaptive, learning layers stay architecturally separate from safety-critical control. The AI proposes, and certified systems enforce.
Human-in-the-loop by design. High-consequence decisions, such as quality dispositions, supplier actions and process parameter changes outside validated windows, go to people with clear context and fast override paths.
Validated before deployed. Simulation is a test bench as well as a training ground. Every model update is checked against the digital twin before it reaches the floor, and changes are documented as rigorously as any other engineering change.
Workforce readiness. Operators, technicians and contractors need real literacy in how these systems behave, where they fail and how to step in. Regulators increasingly expect it.
The organizations that scale Physical AI fastest won’t be the ones that grant the most autonomy. They’ll be the ones whose operators trust the autonomy, because it’s predictable, observable and bounded.
The Strategic Takeaway: Treat Logistics as a Production System
If you’re a plant leader, operations executive or digital transformation owner building a multi-year roadmap, three shifts matter most.
Stop funding logistics automation and production automation as separate programs. Put both under one operating model, one data architecture and one orchestration strategy. The value is in the connections between them.
Invest in the perception and simulation foundation first. Live spatial awareness and a trustworthy digital twin are the prerequisites for every autonomous capability above them. Without them, Physical AI is guessing.
Demand openness from your vendors. Require interoperability standards, edge-capable execution and open APIs. Any robot or system that can’t negotiate with the rest of your fleet will become tomorrow’s island of automation.
The factory of the future won’t be defined by its fastest machine. It will be defined by how well every asset, whether it makes things or moves them, perceives, decides and acts as one system.
The timing is fitting. Rockwell Automation’s Automation Fair is happening November 16-19, in Boston, and production logistics is a featured track there. On Wednesday, November 18, from 11:30am to 3:30pm ET, the event hosts its Production Logistics Summit. The summit opens with a keynote on “Production Logistics: The Next Era of Manufacturing Performance” and includes a customer fireside chat, breakout sessions on bridging disconnected systems and moving from pilot to enterprise-wide autonomy, and a closing panel on the journey to end-to-end autonomous operations.
Join the Conversation
Where does your plant lose the most time today: inside the production process, or in the handoffs that feed it? Is your material flow reacting to production, or still running on yesterday’s schedule? Let’s talk about it in a briefing.
Engage with ARC Advisory Group
Schedule a Briefing. Are you a technology provider bringing Physical AI, mobile robotics or orchestration solutions to manufacturing? Share your roadmap and case studies with our analyst team to be featured in future market maps and columns. Request an executive briefing from Lucas Martin.
The post From Material Flow to Machine Judgment: How Physical AI Connects Production Logistics to Autonomous Operations appeared first on Logistics Viewpoints.

Loftware Acquires Seagull Software from Peak Rock Capital
2027 Ocean Market Outlook

From Material Flow to Machine Judgment: How Physical AI Connects Production Logistics to Autonomous Operations
Freightos Global Freight Outlook – September 2026
Container rates jump another $1k/FEU – but is demand peaking? – July 8, 2026 Update

Walmart and the New Supply Chain Reality: AI, Automation, and Resilience
Trending
- Non classé3 mois ago
Freightos Global Freight Outlook – September 2026
- Non classé4 mois ago
Container rates jump another $1k/FEU – but is demand peaking? – July 8, 2026 Update
-
 Non classé2 ans ago
Walmart and the New Supply Chain Reality: AI, Automation, and Resilience
-

 Non classé7 mois ago
Why Sulfuric Acid Is Emerging as a Supply Chain Constraint in Copper
- Non classé6 mois ago
Container rates starting to spike on peak season rush – June 2, 2026 Update
- Non classé1 an ago
13 Books Logistics And Supply Chain Experts Need To Read
- Non classé1 an ago
Ex-Asia ocean rates climb on GRIs, despite slowing demand – October 22, 2025 Update
- Non classé4 mois ago
LCL Shipping Cost Calculator: Calculate Air and Sea Shipping Freight Rates