
Non classé
Building an Industrial Blueprint for Business Agility

Published
5 mois agoon
By
This is the third in a blog series of four that reviews discussion that occurred during ARC Advisory Group’s 2026 Industry Leadership Forum. Specifically, it details a keynote conversation held with senior executives from Rolls-Royce, BTX Precision, and MxD. Read the full four-part series here: Connected Manufacturing Networks and the New Supply Chain – Logistics Viewpoints
Pillar 2: The Demand Architect
In my previous post, I explored The Market Signal and the shift to real-time, non-linear markets, the first pillar of the modern industrial economy. Today, I’ll dig into the Demand Architect, the orchestrator responsible for fulfilling the value outlined by the market signal.
For decades, the standard operating procedure for industrial OEMs, particularly in discrete markets, was some form of issuing a purchase order, waiting for the parts to arrive, and swinging the penalty stick at the supply chain ecosystem if the order didn’t unfold as planned. That linear, somewhat adversarial approach worked adequately. Today, that transactional model eventually guarantees failure, and those that continue to bake it into their operational DNA are already falling behind.
In today’s increasingly connected business environment, market signals increasingly necessitate decisions that are proactive, accurate, and fast. Passive reaction doesn’t work and will invite disruption that will lead to obsolescence.
During the Wednesday keynote in February at the 30th annual ARC Industry Leadership Forum, I introduced the Demand Architect, exemplified by Greg Davidson, Global Commodity Executive at Rolls-Royce. The Demand Architect is a proactive orchestrator, designing and aligning an incredibly complex ecosystem to respond to the compressed market signals. Greg provided details and examples as to why this second pillar of the new, growing industrial reality is certainly the most visibly disruptive, but also the most necessary.
Moving From Dictation to Orchestration
True industrial innovation and transformation require structural agility and a fundamental shift in leadership and, subsequently, decision making across the organization. Davidson discussed his company’s transition into the Demand Architect role during our panel. On the surface, opening up data and collaborating deeply with external partners seems counterintuitive to lowering risk. However, he noted that following the post-COVID explosion in aerospace demand, Rolls-Royce realized that their traditional “directed buy” model—where the tier-one supplier was solely responsible for managing everything below them—was breaking down under market stress.
While I’m not suggesting leadership necessarily needs to change, that just happened to be the catalyst for Rolls-Royce. The shift began with a new CEO, who came from another industry and so was able to view the aerospace supply chain through a completely different lens. He asked his leadership team a pragmatic question: “What do you guys need to be successful?” It turns out that the answer fell, in part, outside the walls of the organization. Rolls-Royce needed to more aggressively support and collaborate with its supply chain ecosystem.
To be a true Demand Architect, which they saw as mission critical, they had to treat their external partners as extensions of their own enterprise. As an example, they shifted personnel into their raw material teams, expanding it to more than 400 people globally, to actively manage bottlenecks down to the second and third tiers.
Reorganizing for Responsiveness: The “Central Tower” and the “SOS Team”
They also understood that internal changes were required to develop and facilitate a more responsive ecosystem. Rolls-Royce tackled this by creating a “central warehouse” or “central tower” team. Rather than staffing this group only with traditional supply chain experts, they embedded IT and data analytics personnel directly into the team. Their sole job is to build data-driven information capabilities that help segment out market noise, better project demand, and provide operational transparency across the value chain.
Even more radically, they developed an internal “SOS team.” This is a rapid-response group of cross-functional experts, ranging from engineering to demand profiling, with the autonomy to parachute in to help a struggling supplier. Whether a supplier is dealing with casting porosity or struggling to secure rare earth minerals, the SOS team deploys to solve these bottleneck problems that introduce latency in meeting market signals.
Rolls-Royce also put effort into removing any commercial friction related to these interventions. When a severe technical issue arises, they mandate peer-to-peer engineering discussions. An engineer from Rolls-Royce will sit down with the same from the supplier to collaborate on how to fix the problem. Commercial buyers are explicitly banned from the conversation so that any improper vested interest doesn’t influence the outcome. The focus is entirely on the art of the possible and keeping the supply chain moving, not on imposing negative consequences, such as financial penalties.
Tearing Down Walls Without Exposing IP
Achieving this level of architectural agility isn’t easy. It forces incredibly risk-averse companies to overcome the pervasive fear of exposing mission-critical intellectual property. By starting with the market signal, Rolls-Royce was able to define the necessary outcome. In doing so, the value of the benefit was clearly well beyond the risk, which actually turned out to be perceived rather than real once the improvements were put in place.
As I discussed with a few of my ARC colleagues later in the Forum, the solution isn’t to recklessly open the floodgates of data, but to create targeted, secure pathways. Rolls-Royce, for instance, is pushing the envelope by creating new collaborative teams that actively work with and extend into their manufacturing supply chain’s processes. They are fundamentally changing how humans across different companies work together to meet a shared goal.
This is where technology actually earns its keep. The Demand Architect relies on an underlying technical foundation—specifically, Industrial Data Fabrics acting as silo breakers, and Agentic AI to facilitate secure, autonomous communication. By using AI as a targeted toolbox rather than a blanket solution, the Demand Architect manages the massive coordination complexity of this new ecosystem. Technology handles the data meshing and risk mitigation, freeing up the human workforce to do what they do best: focus on delivering production value.
Moving Past Technology Use for the Sake of Technology
Orchestrating a massive, multi-tiered ecosystem requires contextualized data sharing and advanced technological tools. Inevitably, this brings us to the elephant in every room today in artificial intelligence. As I have noted recently, AI is currently the shiniest of shiny objects. The temptation is to throw AI at every process, which inevitably leads to stranded coding, massive computing costs, and counterproductive software bloat. Or as Berardino Baratta, CEO of MxD, perfectly encapsulated, “You don’t need an AI strategy. You need a business strategy that fixes your problems, and AI might be the tool to fix it.”
Innovation leaders approach AI as a powerful toolbox, not a standalone outcome. They use AI to analyze shared design models for manufacturability, to secure data fabrics, and to automate agent-to-agent communication. Furthermore, they strive for VOI (Value on Investment) rather than just traditional ROI, understanding that the strategic value of real-time ecosystem agility exponentially outweighs short-term, isolated efficiency gains.
Finally, successful Demand Architects understand that AI does not replace human ingenuity. Rather, it augments it. If an enterprise attempts to replace human operational knowledge with the artificial variety too quickly, it will cripple its ability to innovate. An effective Demand Architect also recognizes that an enterprise is only as agile as its weakest supplier, and true competitive advantage is built by actively engineering the success of the entire ecosystem.
In our final blog in the series, I’ll outline the third pillar in the new fabric of demand, the agile partner. The blog will outline how companies like BTX Precision have shown market leadership by structurally reorganizing their ecosystem to continuously align with complex market signals in a hyperconnected business world.
The post Building an Industrial Blueprint for Business Agility appeared first on Logistics Viewpoints.
You may like
Non classé
From Prompting to Persistent Decision Workflows in Supply Chain Operations
Published
13 heures agoon
13 octobre 2026By
Supply-chain AI is moving from episodic prompting toward persistent decision workflows. Repeated prompting can help an analyst solve a problem, but an operating capability must maintain context, monitor changing state, preserve decision logic, and connect recommendations to the work that follows.
A persistent decision workflow needs memory of the business object, the current plan, previous recommendations, overrides, policies, and outcomes. Without that continuity, users repeatedly reconstruct context and the model cannot reliably distinguish a new exception from a continuation of an old one. This persistence requirement becomes more important as the AI-agent execution model advances, because an agent cannot act safely if each interaction starts without durable operating state or prior decision context.
A mature design connects detection, context assembly, analysis, option generation, recommendation, approval, execution, and feedback. Some stages may use generative AI; others are better handled by optimization, rules, deterministic integrations, or human judgment. Persistence comes from the workflow and state model, not from the conversational interface.
The system should know what it may observe, recommend, prepare, execute, and escalate. Financial thresholds, customer impact, reversibility, confidence, and policy can determine the autonomy level. These controls make repeated decisions governable at scale.
ERP, planning, TMS, WMS, visibility, risk, and network platforms remain systems of record and execution; decision intelligence sits above and across them where context is assembled, tradeoffs are evaluated, actions are prioritized, and responses are coordinated. The persistent workflow therefore needs controlled write-back or action mechanisms, not only read access and summarization.
A decision workflow should record recommendations, human overrides, actions, and results. That creates an evidence base for improving rules, models, prompts, and autonomy thresholds. A chat transcript alone is not an operating learning system.
The architectural shift is from asking AI for help to designing a governed process in which intelligence participates continuously. That is a much stronger foundation for supply-chain decision support than repeated prompting.
Persistent decision workflows need memory and governance
A durable decision workflow has to preserve operating state across time. It should retain the event, relevant context, alternatives, constraints, prior decisions, approvals, overrides, actions, and outcomes so that the next step does not depend on a user reconstructing the problem in a new prompt. That persistence is what turns AI assistance into an operational capability.
Buyers should test continuity across handoffs. Can the system resume an unresolved decision after new data arrive? Can a different user see why an option was rejected? Can an agent act only within encoded authority? Can the resulting transaction be traced back to the evidence and rule that produced it? These are architecture questions, not user-interface questions.
Persistence changes the economics of decision support
When a workflow is persistent, the organization stops paying the same context-assembly cost every time a decision changes hands. New events can be evaluated against the existing state, prior alternatives remain visible, and approvals or overrides do not have to be reconstructed from email or chat history. That can reduce decision latency while improving traceability. It also creates a better foundation for automation because the system can distinguish a new decision from a continuation of an existing one. Buyers should therefore evaluate memory, state management, versioning, and auditability as operating capabilities rather than treating them as secondary AI features.
The 2026 Market Map is designed to help organizations understand the structure of the Decision Intelligence market, evaluate provider differences, and identify the capabilities most relevant to their operating environment. If your organization is evaluating Decision Intelligence platforms or clarifying where decision intelligence fits within the broader technology architecture, I would be glad to provide the Market Map brochure and discuss the evaluation questions and provider differences most relevant to your requirements.
Request the Decision Intelligence Market Map Brochure
For technology providers
Providers may request the brochure, discuss the research framework, or contact me to confirm how their capabilities are represented in the market assessment.
Non classé
Why SKU Selection Can Make or Break an AS/RS Business Case
Published
14 heures agoon
13 octobre 2026By
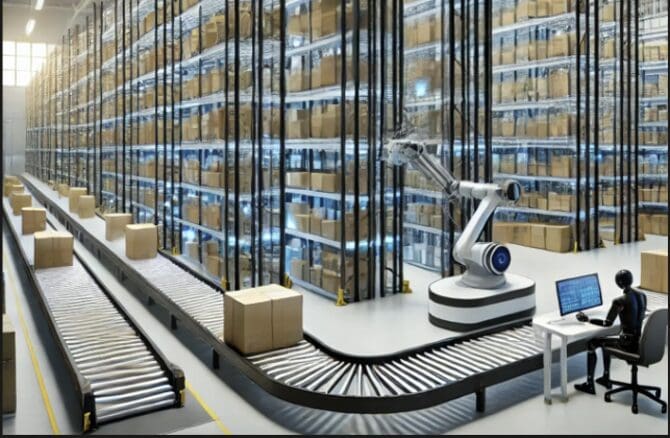
Automated Storage and Retrieval Systems (AS/RS) have become a cornerstone of modern warehouse automation strategies. Whether the technology involves shuttles, cube-based systems, cranes, or goods-to-person solutions, the business case is typically built around a common set of objectives: increasing throughput, reducing labor requirements, improving accuracy, and maximizing storage utilization. Yet one of the most important decisions in any AS/RS implementation often receives far less attention than the technology itself: SKU selection.
Companies frequently spend months evaluating vendors, software platforms, and automation architectures. However, even the most advanced AS/RS can fail to deliver expected returns if the wrong products are placed into the system. In many cases, the difference between a highly successful deployment and a disappointing investment comes down to a simple question: Which SKUs should be automated?
The Purpose of AS/RS Is Productivity, Not Storage
One of the most common misconceptions about AS/RS is that its primary purpose is to store inventory. While increased storage density is certainly a benefit, the real value of automation lies in improving warehouse productivity.
AS/RS creates value by reducing manual labor associated with inventory handling. Every automated retrieval eliminates walking, searching, traveling, and material movement. The more frequently a product is handled, the greater the opportunity for automation to generate measurable savings.
This is where SKU velocity becomes critical.
Not all inventory contributes equally to warehouse activity. In most distribution centers, a relatively small percentage of SKUs generates a disproportionately large percentage of order lines, picks, and replenishment activity. These high-velocity items create the majority of warehouse work and therefore present the greatest opportunity for automation.
Why High-Velocity SKUs Belong in AS/RS
The strongest AS/RS business cases are generally built around automating the products that move most frequently.
Consider two products:
SKU A is picked 2,000 times per week.
SKU B is picked 10 times per month.
Both consume storage space within the AS/RS, but only one generates meaningful operational value.
Every time SKU A is automatically retrieved, labor is eliminated and productivity improves. Over the course of a year, those savings accumulate rapidly. SKU B, on the other hand, occupies valuable automated storage capacity while contributing very little to throughput improvement or labor reduction.
Simply put, high-velocity SKUs produce the transactions that justify the investment.
When organizations prioritize their fastest-moving inventory for AS/RS storage, they maximize:
Labor savings
Pick productivity
Throughput performance
Equipment utilization
Return on investment
This is why leading warehouse operators often use ABC inventory analysis to determine AS/RS eligibility, with A-items receiving priority placement within the automated system.
The Hidden Cost of Selecting the Wrong SKUs
Many automation projects encounter challenges not because the technology underperforms, but because the SKU strategy was flawed from the start.
A common mistake is attempting to place too many slow-moving products into the AS/RS simply because capacity is available. While this may increase storage utilization, it often reduces economic utilization.
An AS/RS filled with low-velocity inventory can create several problems:
Lower Labor Savings
Products that rarely move generate few picking events. As a result, automation replaces little labor activity, weakening the original business case.
Reduced Throughput Benefits
System resources become occupied storing inventory that contributes minimally to order fulfillment activity, limiting the throughput impact of the investment.
Longer Payback Periods
If labor savings and productivity gains fall below projections, the expected payback period can extend significantly beyond the original ROI model.
Capacity Constraints
As demand grows, operators may discover that high-velocity items no longer have sufficient space within the AS/RS because slower-moving products are consuming capacity.
The technology itself may be performing exactly as designed, but the financial return can still disappoint.
Focus on Activity, Not SKU Count
One of the most important lessons for warehouse leaders is that AS/RS success should not be measured by the number of SKUs stored within the system.
Instead, it should be measured by the percentage of warehouse activity flowing through the system.
For example, placing 1,000 high-velocity SKUs into an AS/RS that captures 80% of total picking activity will typically generate greater value than storing 5,000 SKUs that account for only 40% of picks.
The goal is not to automate the greatest amount of inventory.
The goal is to automate the greatest amount of work.
That distinction has significant implications for system utilization and overall project economics.
The Importance of Continuous SKU Evaluation
SKU selection should not be treated as a one-time exercise conducted during system commissioning.
Demand patterns change. Product popularity shifts. New items are introduced while others decline.
As a result, warehouse operators should periodically re-evaluate which products belong inside the AS/RS. High-velocity inventory today may not be high-velocity inventory next year.
Organizations that continuously align automated storage capacity with current demand patterns are often able to sustain higher utilization rates and stronger ROI throughout the life of the system.
ROI strategy
Consider a simple ROI example. Assume a company invests $5 million in an AS/RS and expects to save $1 million annually through labor reduction and productivity improvements. The original business case assumes the system will handle 75 percent of warehouse picking activity.
If the company correctly slots high-velocity products into the system, the projected labor savings can be achieved, resulting in a payback period of approximately five years. However, if management fills a large portion of the AS/RS with slow-moving inventory, the system may only process 40 percent of warehouse picking activity. Annual savings could fall to $600,000, extending the payback period from 5 years to more than 8 years. The technology has not failed. The SKU strategy has.
Final Thoughts
AS/RS technology continues to play an increasingly important role in warehouse automation strategies. Yet successful implementations depend on much more than selecting the right hardware or software platform.
The most effective AS/RS deployments are built around careful SKU selection.
High-velocity products generate the majority of warehouse activity and therefore create the greatest opportunity for labor reduction, throughput improvement, and productivity gains. Conversely, filling automated systems with low-velocity inventory can significantly dilute returns and extend payback periods.
For warehouse and supply chain executives, the takeaway is straightforward: an AS/RS should be designed around activity, not occupancy. The objective is not simply to store products in an automated system. The objective is to automate the work that drives operational performance. In most facilities, that means ensuring the highest-velocity SKUs receive priority access to valuable AS/RS capacity.
The difference between a successful automation investment and an underperforming one may ultimately come down to a decision that appears deceptively simple: choosing the right SKUs.
The post Why SKU Selection Can Make or Break an AS/RS Business Case appeared first on Logistics Viewpoints.
Non classé
What the Descartes Innovation Forum Said About the Next Phase of Logistics Execution
Published
15 heures agoon
13 octobre 2026By
After several days at the 2026 Descartes Innovation Forum, the clearest takeaway was not simply that artificial intelligence is coming to logistics. That part is already obvious. What stood out more was where the technology is moving and why it matters now.
Across the keynote, a transportation leadership panel, a Walmart Marketplace session, and a detailed discussion of carrier fraud, the same operating problem kept surfacing in different forms. Logistics organizations have more data, more applications, more connectivity, and increasingly more AI, but the real value comes when those capabilities help someone make a better decision or execute the next step faster, more reliably, and with the right controls in place.
That matters because the operating environment is not getting easier. Transportation capacity is tightening, rates and fuel costs remain under pressure, fraud and cargo theft are serious concerns, customer expectations continue to rise, and companies are being asked to improve productivity without adding equivalent labor. Against that backdrop, the most interesting technology at the Forum was not technology that simply explained what was happening. It was technology aimed directly at the work itself.
The Swivel-Chair Problem Is Still Real
Descartes opened the Forum with a problem that will sound familiar to anyone who has spent time inside transportation operations. Companies may have capable systems and extensive networks, yet much of the actual work still happens in the gaps between those systems.
Someone receives an email, opens a portal, checks a transportation system, moves to another application, sends a message, waits for a response, updates a record, and then starts the process again somewhere else. Descartes referred to this as the “swivel chair tax,” and the phrase worked because it described a problem technology has never fully eliminated.
The company’s answer is its Agent Control Plane, which is designed to expose capabilities from Descartes applications as skills that AI agents can use. As I covered earlier in Descartes Takes Agentic AI Into the Logistics Workflow at the Descartes Innovation Forum, Descartes was careful to distinguish that approach from a basic chat interface or a traditional workflow engine. The intent is to allow agents to work across applications and adapt as conditions change rather than simply follow a rigid sequence of predefined screens.
The live demonstration made the concept more tangible. Descartes followed an order across four representative companies—a retailer, freight forwarder, customs broker, and final-mile provider—with 15 Descartes products supporting 28 process steps behind the Agent Control Plane. Many of those steps happened without requiring a person to manually move information from one application to another.
What stood out to me was not the amount of automation. It was where Descartes chose not to automate.
At one point, an agent identified a carrier option that could save roughly 8 percent. The carrier, however, had a poor trust score, thin operating history, and other warning signs. Rather than make the lower-cost choice automatically, the system surfaced the decision for human review. The human declined the cheaper carrier.
That is a much more practical model for agentic AI in logistics than the idea of simply handing an operating process over to a machine. Descartes repeatedly described autonomy as a dial, not a switch. Agents have identities, their actions are logged, activity can be replayed, and organizations can determine which decisions require human approval.
The significance is straightforward. Once AI begins taking actions inside real operating processes, governance stops being an abstract IT issue and becomes part of the operating model.
The Market Is Making Better Execution More Valuable
The transportation leadership panel I moderated later in the Forum put that technology discussion into a much tougher operating context.
The freight market described by the panelists was not one of strong demand and easy growth. It was one in which relatively weak demand is colliding with meaningful reductions in capacity. One participant cited a decline in the number of trucking companies from roughly 340,000 to 282,000 and dry-van truckload rates up approximately 33 percent year over year. The larger point was that the conversation has shifted. Two years ago, shippers were largely focused on rates. Today, capacity availability and reliability matter much more.
That tighter environment also increases risk. When capacity is harder to find, there is greater temptation to use carriers that may not have passed the same diligence in a looser market. Panelists tied that pressure to growing concerns around freight fraud, cargo theft, safety, insurance, litigation, and carrier qualification.
As discussed in Transportation Leaders See AI Moving From Experiment to Operating Model at the Descartes Innovation Forum, the response is not simply to cut spending. Technology did not sound discretionary in this discussion. One participant described a single repetitive business activity being performed roughly 750,000 times per month, representing the equivalent of about 1,500 employee-hours per day. That is exactly the kind of workload where automation can move from being interesting to economically significant.
The panel also showed how quickly expectations around technology development are changing. Voice agents, email automation, operational workflows, data science, and agentic AI were all discussed as practical tools rather than distant possibilities. One participant described a proprietary TMS containing more than 30 million lines of code and roughly 2,000 database tables. A 12-person team working with AWS and Anthropic was then tasked with recreating the system using AI-assisted development and reportedly produced a replication in approximately six weeks.
Replicating a system is not the same as proving it in full production, so that example deserves some caution. Still, it shows how quickly the economics of software development may be changing.
Transportation technology has traditionally changed slowly because systems were complex, deeply integrated, and expensive to modify. AI may compress that cycle dramatically. For transportation leaders, that creates an interesting tension: the operating environment is getting harder at the same time that the technology available to respond to it is improving faster.
Walmart Brought the Conversation Back to the Customer
A Walmart Marketplace session provided a useful counterweight to the AI-heavy discussions elsewhere at the Forum. Bryce Caswell, Director of Ship with Walmart for Walmart Marketplace, focused on something much more basic: the customer promise.
Walmart described four foundations for marketplace success—assortment, listing quality, pricing, and shipping—and emphasized that the four are interdependent. Good assortment will not solve poor content. Good content will not offset uncompetitive pricing. And none of it matters if the seller cannot deliver the product when promised.
That may sound obvious, but it was one of the more useful reminders of the Forum. Logistics technology discussions can quickly become dominated by architecture, optimization, visibility, and AI. The customer evaluates something much simpler: did the order arrive when you said it would?
As I wrote in Walmart Is Turning Marketplace Logistics Into a Platform, Walmart’s emphasis was not simply on speed. Reliability and consistency mattered just as much. During holiday peaks, sellers were encouraged to protect inventory availability, leave enough time to move product into the fulfillment network, understand what they are promising, and then meet that promise.
The company is also trying to simplify the mechanics underneath that promise. Walmart Fulfillment Services provides pick, pack, and ship capabilities through Walmart’s fulfillment network, while its multi-channel model allows sellers to support multiple sales channels from a single inventory pool.
Ship with Walmart extends that logic into transportation by offering access to negotiated carrier rates, including national, regional, and LTL options, while adding certain protections around on-time delivery and lost shipments.
The larger point is that simplification has value only if it improves execution. Whether the tool is an AI agent or a fulfillment network, the objective is the same: remove unnecessary friction so people can focus on the decisions and exceptions that actually matter.
Fraud Changes the Meaning of Visibility
The Forum’s carrier fraud session added another layer to the discussion because it showed how operating data is being repurposed for trust.
Descartes demonstrated how MyCarrierPortal and MacroPoint can be used together to strengthen carrier vetting before a load is tendered. The process extends beyond checking insurance or basic carrier status. It can incorporate configurable risk assessments, tracking history, lane history, inspection information, validated users, equipment data, and driver-level tracking statistics.
That is a subtle but important shift in how transportation visibility data is used. Historically, tracking information primarily answered a familiar question: where is my load? Increasingly, that same information can help answer a different question: should I trust the party moving it?
The same theme runs through Descartes Expands Freight Fraud Prevention Across Carrier Vetting and Shipment Execution. Descartes showed how historical lane activity and tracking behavior can be used as additional carrier-vetting signals. Once a shipment is in transit, the Notification Center can surface route deviations and other exceptions that warrant attention without requiring someone to monitor every load manually.
ELD Plus adds another layer by allowing two tracking sources to be used within the same tracking session. If mobile-device data and telematics data begin to diverge, that mismatch becomes a signal that someone may need to investigate.
Carrier lookup goes further by combining information such as power units, active loads, tracking history, spoofing flags, and recent lane activity. The example used during the session was simple: if a carrier has 100 power units but appears to be active on 600 loads, that discrepancy may deserve a closer look.
More automation does not reduce the need for trust. It raises the stakes. If systems are going to make recommendations or take actions faster, the quality of the signals behind those decisions becomes even more important.
Execution Is Becoming the Real Battleground
Looking back across the Forum, I do not think the central story was simply AI. It was execution.
Descartes is trying to reduce the swivel-chair work that still exists between logistics applications and companies. Transportation leaders are looking for technology that can improve productivity and help them operate through a tighter, riskier freight market. Walmart is focused on simplifying fulfillment so sellers can keep the customer promise. Carrier-verification tools are turning tracking data into a source of trust as well as visibility.
Put together, that points to a broader shift in logistics technology. Software is moving closer to the actual transaction, the actual decision, and the actual exception. The value of that technology will increasingly be judged by whether it helps organizations act better, not simply see more.
The companies that benefit most will not necessarily be the ones with the most AI, the most dashboards, or the most data. They will be the ones that can connect intelligence to execution without losing control of the process.
For me, that was the real takeaway from the 2026 Descartes Innovation Forum. The next phase of logistics technology is not just about making systems smarter. It is about knowing when the system should act, when a person should decide, and how to make both work together fast enough to keep freight moving and the customer promise intact.
The post What the Descartes Innovation Forum Said About the Next Phase of Logistics Execution appeared first on Logistics Viewpoints.

From Prompting to Persistent Decision Workflows in Supply Chain Operations

Why SKU Selection Can Make or Break an AS/RS Business Case
What the Descartes Innovation Forum Said About the Next Phase of Logistics Execution
Freightos Global Freight Outlook – September 2026
Container rates jump another $1k/FEU – but is demand peaking? – July 8, 2026 Update

Walmart and the New Supply Chain Reality: AI, Automation, and Resilience
Trending
- Non classé1 mois ago
Freightos Global Freight Outlook – September 2026
- Non classé3 mois ago
Container rates jump another $1k/FEU – but is demand peaking? – July 8, 2026 Update
-
 Non classé2 ans ago
Walmart and the New Supply Chain Reality: AI, Automation, and Resilience
-

 Non classé6 mois ago
Why Sulfuric Acid Is Emerging as a Supply Chain Constraint in Copper
- Non classé4 mois ago
Container rates starting to spike on peak season rush – June 2, 2026 Update
- Non classé1 an ago
13 Books Logistics And Supply Chain Experts Need To Read
- Non classé12 mois ago
Ex-Asia ocean rates climb on GRIs, despite slowing demand – October 22, 2025 Update
- Non classé3 mois ago
LCL Shipping Cost Calculator: Calculate Air and Sea Shipping Freight Rates