
Non classé
From Nodes to Networks: Graph RAG in Supply Chains – Part 5

Published
12 mois agoon
By

Download the full white paper – AI in the Supply Chain
While Retrieval-Augmented Generation (RAG) improves the accuracy and relevance of AI output by connecting it to structured knowledge, it still treats that knowledge largely as disconnected chunks, pages, paragraphs, or entries retrieved for context. But supply chains are not flat; they are complex, interrelated systems composed of entities, suppliers, facilities, products, regulations, linked by dependencies, risks, and transactions.
To reason across this complexity, the next generation of AI systems integrates RAG with a knowledge graph, resulting in what’s now referred to as Graph RAG.
1. What Is Graph RAG?
Graph RAG combines:
RAG’s retrieval and generation capabilities
A knowledge graph, which models entities (e.g., a supplier, a warehouse, a contract clause) and the relationships between them (e.g., supplies, ships to, depends on, governed by)
Instead of retrieving and processing isolated documents, Graph RAG allows AI to:
Traverse structured relationships
Understand multi-hop dependencies (e.g., “Supplier A → Port B → Distribution Center C”)
Infer risks, consequences, or alternatives based on the shape of the supply network
It shifts AI from document-based reasoning to system-based reasoning.
2. Why Graph Structures Matter in Supply Chains
Supply chains are inherently graph-like:
A single supplier may support multiple products
A port delay affects many downstream orders
A regulation impacts specific trade lanes and product types
Transportation routes, warehouse transfers, and carrier networks form dynamic, high-dimensional graphs
Reasoning through these interconnections is essential to:
Identifying root causes (e.g., “Why is my lead time increasing?”)
Modeling cascading effects (e.g., “If Port Y is congested, how many SKUs are at risk?”)
Finding optimal alternatives (e.g., “Which alternate routes avoid this constraint?”)
Traditional AI systems, even with RAG, struggle to synthesize these answers. Graph RAG is built to navigate them naturally.
3. Applications of Graph RAG in Supply Chains
Disruption Analysis:
A weather event affects a port. The Graph RAG system identifies all inbound shipments, suppliers relying on that port, affected customers, and risk-adjusted mitigation options, automatically.
Strategic Sourcing:
By traversing supplier networks, component relationships, and geographic risks, the system recommends resilient sourcing strategies with minimal overlap or risk concentration.
Compliance Monitoring:
When a new trade regulation is issued, the system identifies which SKUs, suppliers, and trade lanes are affected, using graph traversal and targeted document retrieval.
Inventory Optimization:
Graph RAG helps balance multi-node inventory levels by modeling upstream-downstream interdependencies and lead time fluctuations across the network.
Carbon Emissions Modeling:
AI agents compute scope 3 emissions based on transport paths, vendor locations, and material movements, all modeled as a directed graph.
4. Architecture: How Graph RAG Works
Knowledge Graph Construction:
Nodes: Entities such as locations, shipments, contracts, or people
Edges: Relationships such as “ships to,” “depends on,” “complies with”
Data sources: ERP, TMS, WMS, procurement systems, regulatory bodies, supplier portals
Graph-Aware Retrieval:
Instead of searching flat documents, the AI traverses the graph to identify related nodes and fetches only the most relevant facts.
Context Injection into Generation:
Retrieved graph-structured facts are then passed to the language model, which generates a response that is not just informed, but relationally aware.
Ongoing Updates:
Graphs are continuously updated through APIs and event streams (e.g., a delayed container updates the edges related to dependent orders and downstream production).
Tools used may include:
Neo4j or Amazon Neptune for graph storage
LangChain, Haystack, or LlamaIndex for RAG orchestration
Vector databases (e.g., Pinecone, Weaviate) for parallel text-based retrieval
5. Key Benefits of Graph RAG
Holistic Insight: Understand system-wide impacts of localized disruptions
Explainability: Trace decisions across linked entities and interactions
Precision: Retrieve the exact information relevant to a network scenario
Scalability: Manage large-scale networks with millions of relationships
Proactivity: Identify risks, chokepoints, or opportunities before they escalate
6. Limitations and Design Considerations
Graph Construction Complexity: Requires a well-governed master data model and consistent entity resolution
System Integration: Must span across ERP, WMS, CRM, and external data feeds
Latency and Compute Load: Traversing large graphs in real time can be resource-intensive
Change Management: Stakeholders must trust a system making decisions across dozens of linked domains
Despite these hurdles, Graph RAG offers a substantial leap forward in AI’s ability to navigate the interconnected nature of modern supply chains.
Microsoft is incorporating graph-based models in its Copilot for Dynamics 365, enabling richer context in supply chain planning and customer service.
SAP Business AI has introduced early-stage graph traversal features for production planning and logistics scenario modeling.
Global logistics providers are experimenting with Graph RAG to assess port congestion impacts and reroute traffic across multimodal networks.
Graph RAG represents a convergence of structured reasoning and unstructured understanding, the first real step toward AI systems that don’t just answer questions but operate like experienced supply chain managers, constantly weighing options and interdependencies.
But this intelligence can’t operate in a vacuum. It depends on well-prepared data and unified system infrastructure, which brings us to the topic of data harmonization.
[Download AI in the Supply Chain](https://logisticsviewpoints.com/download-the-ai-in-the-supply-chain-white-paper/)
The post From Nodes to Networks: Graph RAG in Supply Chains – Part 5 appeared first on Logistics Viewpoints.
You may like
Non classé
Can Real-Time Voice Translation Improve Warehouse Productivity and Employee Engagement?
Published
19 heures agoon
14 octobre 2026By
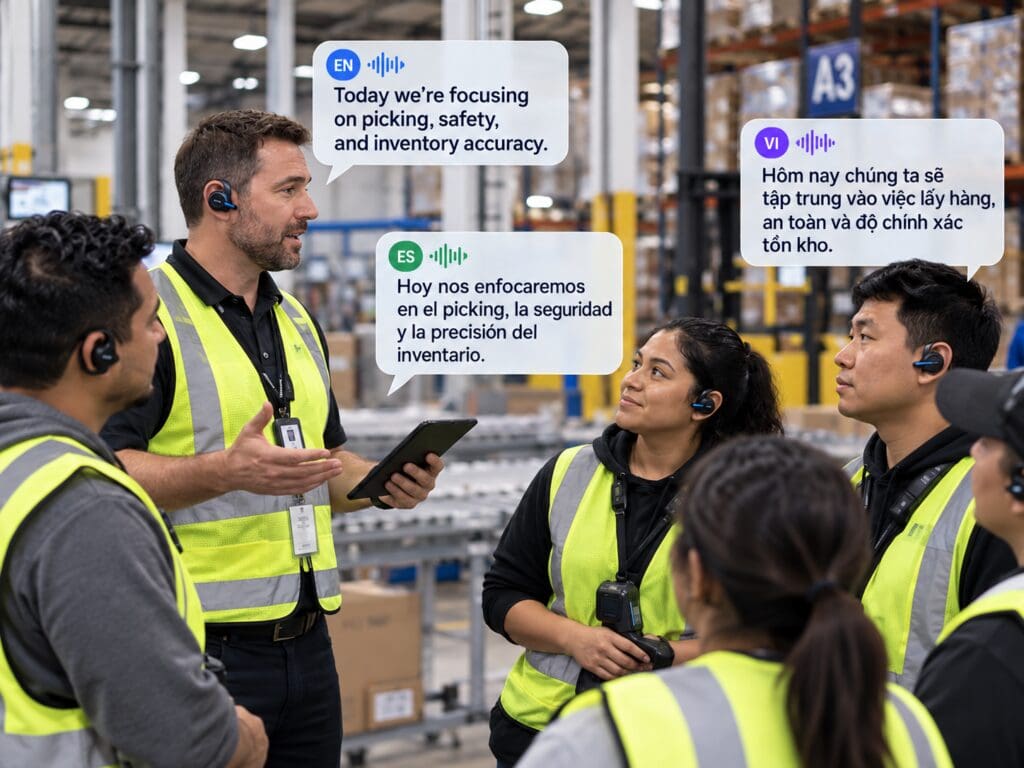
Labor shortages remain one of the most persistent challenges facing warehouse operators. Yet an often-overlooked issue sits beneath the labor discussion: communication. Modern distribution centers frequently employ associates who speak a variety of languages. While workforce diversity is a strength, language barriers can create delays, safety risks, training challenges, and unnecessary dependence on a small number of bilingual employees.
This challenge is becoming increasingly relevant across North America. Distribution centers routinely employ associates representing multiple linguistic backgrounds. As labor shortages persist, operators are focusing less on hiring workers who speak a common language and more on ensuring communication systems can accommodate workforce diversity. Technology that bridges language gaps can therefore expand the labor pool while improving workforce effectiveness.
Historically, many operations have relied on supervisors or bilingual associates to bridge communication gaps. The problem is that those employees are frequently pulled away from their primary responsibilities to interpret instructions, explain process changes, or translate safety information. In a high-velocity warehouse environment, those interruptions create hidden productivity losses.
Recent advances in real-time voice translation technology are changing this dynamic. Solutions such as Relay’s TeamTranslate allow workers to communicate in their preferred language while messages are translated and delivered to others in near real time.
Consider a common warehouse scenario. A distribution center employs workers who primarily speak English, Spanish, and Vietnamese. During a shift startup meeting, supervisors must communicate labor priorities, inventory issues, quality concerns, and safety reminders. Without automated translation tools, information often flows through a bilingual intermediary. Even when translation is accurate, the process consumes time and introduces opportunities for misunderstanding.
With real-time translation, every worker can hear instructions in a familiar language. Communication becomes direct rather than dependent on an interpreter. Managers spend less time repeating instructions, and bilingual associates remain focused on their assigned tasks instead of serving as unofficial translators.
Relay highlights examples from warehouse operations where managers reported stronger understanding between English- and Spanish-speaking associates after implementing translation capabilities. Improved understanding contributed to better alignment and higher production levels.
The ROI opportunity can be meaningful. Consider a 200-person distribution center operating two shifts. If five supervisors each spend fifteen minutes per day locating a bilingual employee to translate instructions, answer questions, or communicate process changes, the facility loses more than 625 supervisory hours annually. At a fully burdened labor cost of $40 per hour, that represents approximately $25,000 in indirect labor costs before accounting for throughput improvements, reduced errors, and fewer delays.
The impact extends beyond productivity. Safety is another significant consideration. Warehouses depend on clear communication for forklift traffic management, hazardous material handling, evacuation procedures, and incident reporting. When critical messages are misunderstood because of language barriers, the consequences can be serious.
Training and onboarding may benefit as well. New employees often face a steep learning curve. Translation-enabled communication allows new hires to learn in their preferred language, potentially reducing training time while increasing confidence.
An emerging category of frontline communication technology is focused on solving these challenges. Vendors such as Relay, Zebra Workforce Connect, Microsoft Teams Walkie Talkie, Theatro, Honeywell Voice, and WorkJam are expanding communication capabilities for deskless workers. Historically, many solutions focused on push-to-talk communication or task management. AI-powered language translation introduces a new capability by directly addressing communication friction between workers.
Perhaps the most interesting impact is cultural rather than operational. Many warehouses consist of diverse teams that work side by side every day but communicate primarily within their own language groups. Technology that allows people to communicate naturally can help create a more inclusive workplace. Employees become more comfortable asking questions, sharing ideas, and participating in team discussions.
This matters because engagement and retention are increasingly strategic priorities. Employees who feel heard and understood are more likely to contribute, collaborate, and remain with an organization.
Takeaway and Market Outlook
For years, warehouse automation investments have focused primarily on moving products more efficiently. Robots, ASRS systems, autonomous mobile robots, and warehouse software have targeted improvements in material flow. Yet communication remains one of the least automated processes within many facilities.
Real-time voice translation represents an interesting shift because it focuses on people rather than equipment. By reducing dependence on bilingual intermediaries, organizations can improve productivity, accelerate onboarding, strengthen safety compliance, and create a more inclusive work environment.
Looking ahead, AI-enabled communication tools are likely to become increasingly common across warehouse and manufacturing environments. Facilities have spent decades optimizing the movement of inventory. The next frontier may be optimizing the flow of information between workers. If technologies such as real-time voice translation continue to demonstrate measurable workforce and operational benefits, they could become a standard component of the digital warehouse technology stack.
The post Can Real-Time Voice Translation Improve Warehouse Productivity and Employee Engagement? appeared first on Logistics Viewpoints.
Non classé
Blue Yonder Is Redesigning Supply Chain Software Around Decisions, Not Screens
Published
19 heures agoon
14 octobre 2026By
Blue Yonder is rethinking how users interact with supply chain applications as artificial intelligence takes on a larger role in planning and execution.
During a recent analyst briefing, Blue Yonder Chief Design Officer Nunzio Esposito outlined the company’s effort to move away from traditional application navigation and toward a more decision-centric model. The company is bringing together AI agents, recommendations, workflows, mobile capabilities, and collaboration tools through what it calls Blue Yonder Orchestrator.
The objective is to reduce the amount of manual navigation and repetitive interaction required from users. Instead of moving through multiple screens to find information and determine what requires attention, Blue Yonder wants its applications to surface the relevant information, recommendations, and decisions more directly.
The broader idea is that users should spend less time operating the mechanics of enterprise software and more time making higher-value decisions.
From Navigation to Orchestration
At the center of the strategy is Blue Yonder Orchestrator, which the company describes as a harness for creating a more coherent experience across its cognitive applications.
Orchestrator can use context including the business process, the user’s role and policies, and the situation in which the application is being accessed. Blue Yonder says this allows the system to determine what information should be presented, who may need to be involved, and what decision may need to be made.
This also affects the role of the traditional dashboard. Esposito described Blue Yonder’s briefing capability as a more intelligent version of a dashboard, with the objective of bringing users into the process when a higher-value judgment is required while allowing lower-level tasks to be handled by agents.
Blue Yonder is also consolidating functions including search, lookup, favorites, navigation, and interaction with agents into a more centralized access point. The company says this can reduce duplication in the interface while giving users a more consistent way to access different capabilities.
The system can also use information such as frequency of use, previous activity, and user-journey patterns to determine what is presented to the operator. According to Blue Yonder, those interactions feed back into its context graph and help Orchestrator respond more dynamically.
Extending the Experience Beyond a Single Application
Blue Yonder’s vision also extends beyond the desktop application.
Esposito said the company wants its capabilities and intelligence to be accessible wherever the user is working, including desktop systems, phones, voice-enabled environments, industrial warehouse devices, and potentially wearables. The company’s goal is to maintain continuity as users move among those environments.
That approach is already visible in Microsoft Teams. Blue Yonder has made some of its domain-agent capabilities available through Teams, allowing users to perform lookups and engage with Blue Yonder intelligence without necessarily returning to the application itself.
In logistics, Esposito pointed specifically to the logistics operations agent being available in Microsoft Teams. He described a scenario in which a procurement manager could ask about current activity and outstanding issues while remaining in Teams rather than moving back into the underlying logistics application.
This supports one of the central themes of the briefing: Blue Yonder does not believe its intelligence should be limited to a single application surface.
Warehouse Applications Put the Strategy Into Practice
The warehouse is one area where Blue Yonder has already applied this design approach.
The company has developed two role-specific mobile applications, one for warehouse operators and another for warehouse supervisors. The applications were developed using Blue Yonder’s mobile studio and were designed with industrial devices in mind.
Esposito said the warehouse effort focused on reducing clicks, maintaining application performance, and helping workers complete tasks more efficiently. Blue Yonder has also been examining measures including decision time and speed to completion as it evaluates these experiences.
The company is also introducing what it calls a decision-based workflow, or workbook. The concept is intended to give users a view of the jobs and tasks that need to be completed, while also providing context around who may be involved and where the work stands. Blue Yonder says the approach is intended to reduce cognitive load and improve collaboration.
For warehouse technology users, the relevance is fairly direct. Small reductions in clicks, navigation, or decision time can become meaningful when those interactions are repeated throughout a shift.
That is an LV interpretation rather than a specific Blue Yonder claim, but it helps explain why application design can have an operational impact in a warehouse environment.
Generative Interfaces and Cognitive Coaching
Blue Yonder is also developing concepts that go beyond simplifying existing interfaces.
One of those is the generative user interface. Esposito described a future in which interfaces could be curated more dynamically based on the information and situation at hand rather than remaining completely fixed.
The company is also developing what it calls Cognitive Coach. Blue Yonder is using information about what a user needs to do, how that user makes decisions, and who the user collaborates with to explore more personalized in-context assistance.
Esposito connected this effort to the broader issue of AI adoption and role transformation. He argued that companies need to think not only about the technology itself, but also about how jobs change as more activities are handled by agents.
Blue Yonder’s objective is to make that transition less disruptive by reducing the amount of change management required as users move from current ways of working toward more AI-assisted processes.
Managing AI Models and Consumption
The briefing also addressed how Blue Yonder manages different AI models.
Esposito said the company selects different models for different activities and can orchestrate multiple models based on the task being performed. He also noted that cost is one of the factors considered in that orchestration.
Blue Yonder is introducing a capability called Mission Hub that provides visibility into areas including the roles in the system, policies and entitlements, GenAI consumption, and which models and agents are being activated. The company said the capability will also help users understand the infrastructure cost associated with that activity.
Through GenAI Studio, customers can also choose models and establish limits or boundaries around their use. Esposito said customers are not limited to Blue Yonder automatically orchestrating those decisions for them.
This introduces a practical layer to the agentic AI discussion. As AI usage expands inside enterprise applications, customers will need visibility into which models and agents are being used and what that consumption costs.
That conclusion is analytical, but it follows directly from the capabilities Blue Yonder described.
The Larger Shift
The most important theme in the briefing was not a single application or interface feature. It was the way Blue Yonder believes the relationship between the user and the application is changing.
The company is trying to reduce manual navigation, surface decisions more directly, and allow agents to handle more of the lower-level activity surrounding those decisions. At the same time, Blue Yonder is extending those interactions across devices and collaboration environments rather than assuming that all work will take place inside one application.
Some of these capabilities are already available, while others remain in development. The company’s December releases, continued work on Cognitive Coach, and generative-interface efforts will provide additional evidence of how far this model can move from concept into day-to-day supply chain operations.
The direction, however, is clear. Blue Yonder is designing its applications around a future in which the user spends less time navigating software and more time deciding what needs attention, what can be delegated, and what action should come next.
The post Blue Yonder Is Redesigning Supply Chain Software Around Decisions, Not Screens appeared first on Logistics Viewpoints.
Non classé
Supply Chain Risk Management Is Moving From Alert Generation to Operational Response
Published
20 heures agoon
14 octobre 2026By
Executive thesis. Supply-chain risk management is moving from signal accumulation to consequence management. More alerts are not an advantage if the enterprise cannot map them to actual products, suppliers, sites, lanes, inventory, customers, or revenue.
Risk teams do not need more undifferentiated alerts
Supply chain risk platforms have become capable of collecting external signals about weather, geopolitics, suppliers, cyber events, infrastructure, finance, and other disruption sources. The challenge is that awareness does not equal response. A long queue of alerts can overwhelm the organization unless the system can determine which events intersect with real operational exposure.
Exposure mapping creates relevance
A disruption becomes actionable when it can be mapped to suppliers, sites, products, materials, lanes, customers, inventory, revenue, or service commitments. That requires multi-tier relationship data and a clear understanding of dependencies. Without that context, the enterprise may know that an event occurred but still lack a defensible answer to the question: what does this mean for us?
Prioritization should be consequence-based
Risk scoring is most effective when it helps allocate scarce attention. As a result, considering probability, exposure, time horizon, substitution options, inventory, capacity, and customer impact rather than relying on event severity alone. The same storm, port closure, or supplier issue can be immaterial to one business flow and critical to another.
Mitigation needs workflow and ownership
Once material risk is identified, the platform should support the response: investigate, validate, assign an owner, evaluate alternatives, obtain approval, execute mitigation, and track closure. Otherwise the risk platform becomes a notification system whose output has to be managed in separate tools. The value lies in shortening the path from detection to controlled action.
Scenario capability turns awareness into preparedness
Risk management improves when the organization can model alternatives before a disruption occurs. Alternate suppliers, substitute materials, inventory buffers, routes, capacity, and manual fallback can be evaluated and exercised in advance. That turns risk technology from a monitoring layer into part of the operating model for resilience.
The Logistics Viewpoints Supply Chain Risk Management Software: Buyer’s Guide evaluates external intelligence, multi-tier mapping, dependency and exposure analysis, mitigation workflow, scenarios, integrations, and alert quality as parts of one response system.
Executive implication
Risk technology should be evaluated by its ability to establish exposure, prioritize consequence, assign ownership, and accelerate executable mitigation.
Go deeper: provides the durable buyer, architecture, and implementation reference for this topic. Risk, Resilience & Security connects this analysis to the broader Logistics Viewpoints research architecture.
Related Logistics Viewpoints research
Best Practices in Supplier Risk Management
Go Deeper
Read the full Supply Chain Risk Management Software: Buyer’s Guide.
Explore the broader Risk, Resilience & Security domain for related Logistics Viewpoints research and analysis.
The post Supply Chain Risk Management Is Moving From Alert Generation to Operational Response appeared first on Logistics Viewpoints.


Can Real-Time Voice Translation Improve Warehouse Productivity and Employee Engagement?
Blue Yonder Is Redesigning Supply Chain Software Around Decisions, Not Screens
Supply Chain Risk Management Is Moving From Alert Generation to Operational Response
Freightos Global Freight Outlook – September 2026
Container rates jump another $1k/FEU – but is demand peaking? – July 8, 2026 Update

Walmart and the New Supply Chain Reality: AI, Automation, and Resilience
Trending
- Non classé1 mois ago
Freightos Global Freight Outlook – September 2026
- Non classé3 mois ago
Container rates jump another $1k/FEU – but is demand peaking? – July 8, 2026 Update
-
 Non classé2 ans ago
Walmart and the New Supply Chain Reality: AI, Automation, and Resilience
-

 Non classé6 mois ago
Why Sulfuric Acid Is Emerging as a Supply Chain Constraint in Copper
- Non classé4 mois ago
Container rates starting to spike on peak season rush – June 2, 2026 Update
- Non classé1 an ago
13 Books Logistics And Supply Chain Experts Need To Read
- Non classé12 mois ago
Ex-Asia ocean rates climb on GRIs, despite slowing demand – October 22, 2025 Update
- Non classé3 mois ago
LCL Shipping Cost Calculator: Calculate Air and Sea Shipping Freight Rates